Volume 26, Number 7—July 2020
Research
Identifying Locations with Possible Undetected Imported Severe Acute Respiratory Syndrome Coronavirus 2 Cases by Using Importation Predictions
Figure 2

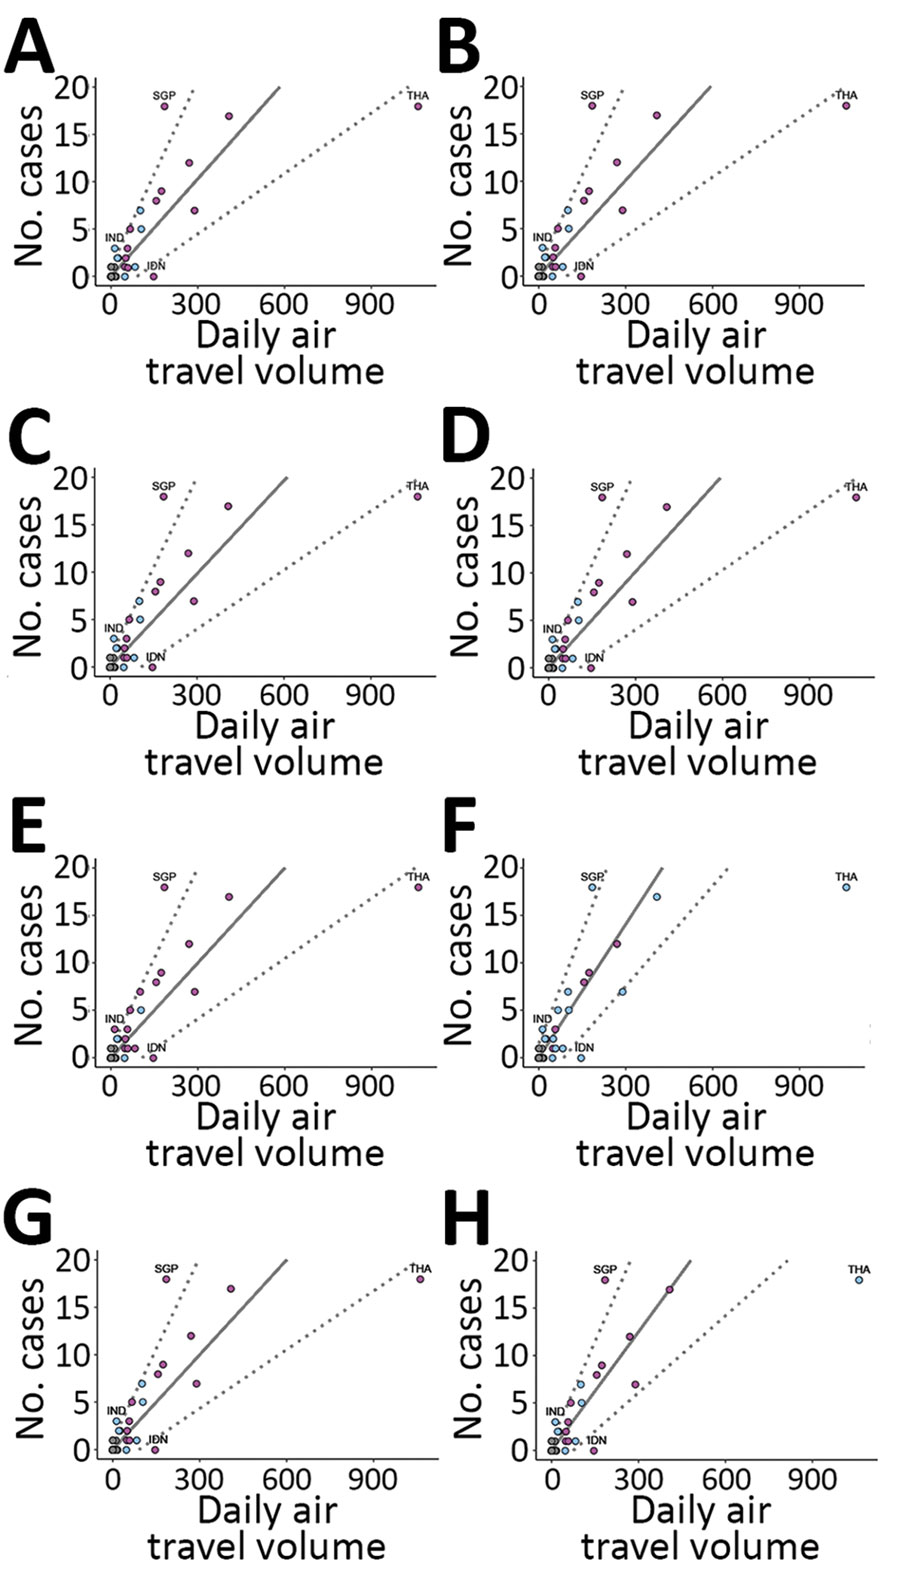
Figure 2. Analyses of imported-and-reported cases and daily air travel volume using a model to predict locations with potentially undetected cases of severe acute respiratory virus 2 (SARS-CoV-2). Air travel volume measured in number of persons/day. No. cases refers to possible undetected imported SARS-CoV-2 cases. Solid line shows the expected imported-and-reported case counts based on our model fitted to high surveillance locations, indicated by purple dots. Dashed lines indicate the 95% prediction interval bounds smoothed for all locations, including those with low surveillance capacity, indicated by light blue dots. A–C) Regressions that set the daily air travel volume for locations not listed by S. Lai et al. (unpub. data, https://doi.org/10.1101/2020.02.04.20020479): A) air travel volume set to 0.1 passenger/day; B) volume set to 1 passengers/day; C) volume set to 6 passengers/day. D) Regression removing locations not listed by Lai et al. before fitting. E) Regression defining high surveillance locations by using a more lenient Global Health Security (GHS) Index criterion (50th quantile) for category 2, Early Detection and Reporting of Epidemics of Potential International Concern, to define high surveillance locations. F) A more stringent GHS Index criterion (95th quantile) to define high surveillance locations. G) Regression using a negative binomial likelihood and estimated dispersion parameter of 1.27 (p = 0.097). H) Regression excluding Thailand from the model fit. Across all 8 regression analyses, Singapore lies above the 95% PI and Thailand and Indonesia lie below. India remained above 95% PI for all regressions, except when we used a more stringent GHS Index criterion (panel F). IDN, Indonesia; IND, India; SGP, Singapore; THA, Thailand.
1These authors contributed equally to this article.