Skip directly to site content Skip directly to page options Skip directly to A-Z link Skip directly to A-Z link Skip directly to A-Z link
Volume 26, Number 8—August 2020
Dispatch

Evolution and Antigenic Drift of Influenza A (H7N9) Viruses, China, 2017–2019

Jiahao Zhang1, Hejia Ye1, Huanan Li1, Kaixiong Ma, Weihong Qiu, Yiqun Chen, Ziwen Qiu, Bo Li, Weixin Jia, Zhaoping Liang, Ming LiaoComments to Author , and Wenbao QiComments to Author 
Author affiliations: College of Veterinary Medicine, South China Agricultural University, Guangzhou, China (J. Zhang, H. Li, K. Ma, Y. Chen, Z. Qiu, B. Li, W. Jia, M. Liao, W. Qi); National Avian Influenza Para-Reference Laboratory, Ministry of Agriculture and Rural Affairs of the People’s Republic of China, Guangzhou (J. Zhang, H. Li, W. Jia, M. Liao, W. Qi); Key Laboratory of Animal Vaccine Development, Ministry of Agriculture and Rural Affairs of the People’s Republic of China, Guangzhou (J. Zhang, W. Jia, M. Liao, W. Qi); National and Regional Joint Engineering Laboratory for Medicament of Zoonoses Prevention and Control, National Development and Reform Commission, Guangzhou (J. Zhang, W. Jia, M. Liao, W. Qi); Key Laboratory of Zoonoses Prevention and Control of Guangdong Province, Guangzhou (J. Zhang, W. Jia, M. Liao, W. Qi); Guangzhou South China Biological Medicine Co., Ltd, Guangzhou (H. Ye, W. Qiu, Z. Liang); Guangdong Laboratory for Lingnan Modern Agriculture, Guangzhou (W. Jia, M. Liao, W. Qi)

Main Article

Figure 2

Time-scaled evolution of influenza A(H7N9) viruses, China. A) Analysis of root-to-tip divergence against sampling date for the hemagglutinin gene segment (n = 189). B) Maximum clade credibility tree of the hemagglutinin sequence of H7N9 viruses sampled in China (n = 189); the H7N9 viruses collected in this study are highlight in red. Asterisk indicates viruses from a human with H7N9 infection within sublineage B during March 2019. Shaded bars represent the 95% highest probability distribution fo

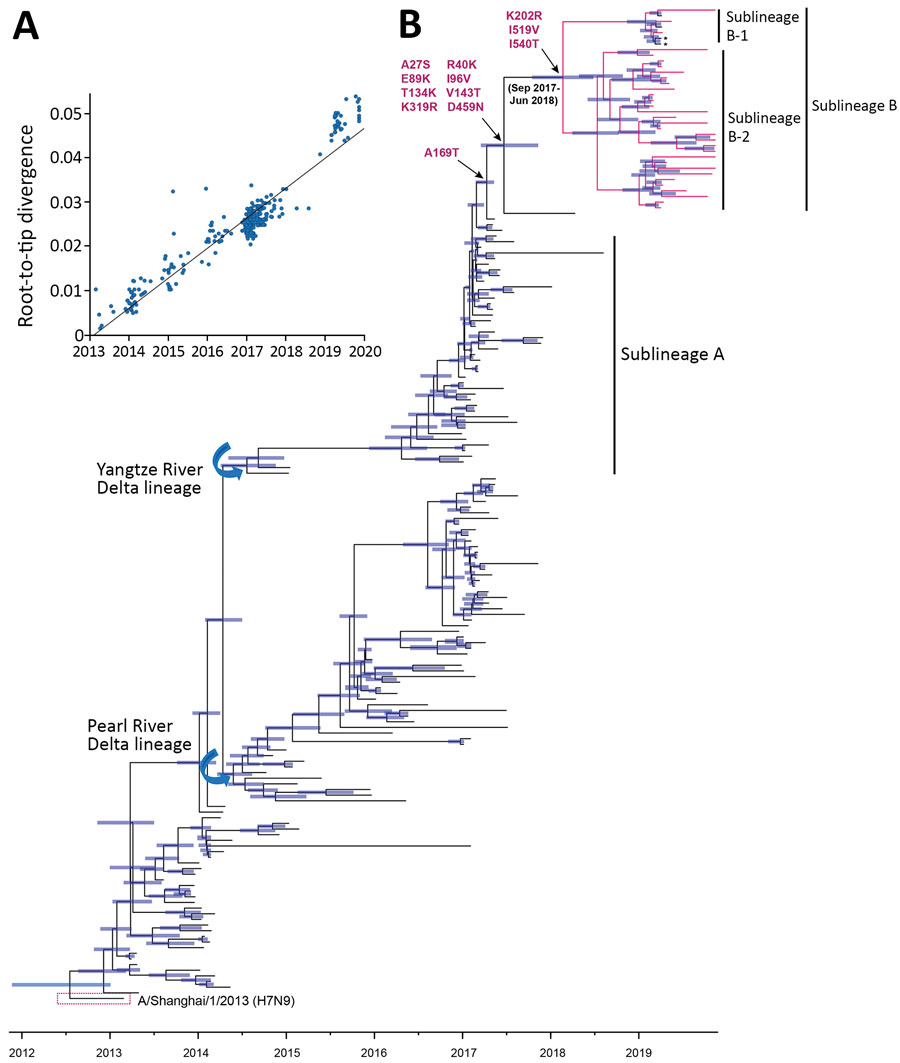
Figure 2. Time-scaled evolution of influenza A(H7N9) viruses, China. A) Analysis of root-to-tip divergence against sampling date for the hemagglutinin gene segment (n = 189). B) Maximum clade credibility tree of the hemagglutinin sequence of H7N9 viruses sampled in China (n = 189); the H7N9 viruses collected in this study are highlighted in red. Asterisk indicates viruses from a human with H7N9 infection within sublineage B during March 2019. Shaded bars represent the 95% highest probability distribution for the age of each node. Parallel amino acid changes along the trunk are indicated.

Main Article

1These authors contributed equally to this article.

Page created: June 12, 2020
Page updated: July 19, 2020
Page reviewed: July 19, 2020
The conclusions, findings, and opinions expressed by authors contributing to this journal do not necessarily reflect the official position of the U.S. Department of Health and Human Services, the Public Health Service, the Centers for Disease Control and Prevention, or the authors' affiliated institutions. Use of trade names is for identification only and does not imply endorsement by any of the groups named above.
file_external