Skip directly to site content Skip directly to page options Skip directly to A-Z link Skip directly to A-Z link Skip directly to A-Z link
Volume 26, Number 9—September 2020
Research

Heterogeneity of Dengue Illness in Community-Based Prospective Study, Iquitos, Peru

William H. Elson, Robert C. Reiner, Crystyan Siles, Isabel Bazan, Stalin Vilcarromero, Amy R. Riley-Powell, Ania B. Kawiecki, Helvio Astete, Robert D. Hontz, Chris M. Barker, Gonzalo M. Vazquez-Prokopec, Amy C. Morrison, Thomas W. Scott, John P. Elder, Alan L. Rothman, and Valerie A. Paz-Soldan
Author affiliations: University of California Davis, Davis, California, USA (W.H. Elson, A.B. Kawiecki, C.M. Barker, A.C. Morrison, T.W. Scott); University of Washington School of Medicine, Seattle, Washington, USA (R.C. Reiner); US Naval Medical Research Unit No. 6, Lima and Iquitos, Peru (C. Siles, I. Bazan, S. Vilcarromero, H. Astete, R.D. Hontz, A.C. Morrison); University of Sussex, Brighton, UK (A.R. Riley-Powell); Tulane School of Public Health and Tropical Medicine, New Orleans, Louisiana, USA (A.R. Riley-Powell, V.A. Paz-Soldan); Emory University, Atlanta, Georgia, USA (G.M. Vazquez-Prokopec); San Diego State University, San Diego, California, USA (J.P. Elder); University of Rhode Island, Providence, Rhode Island, USA (A.L. Rothman)

Main Article

Figure 2

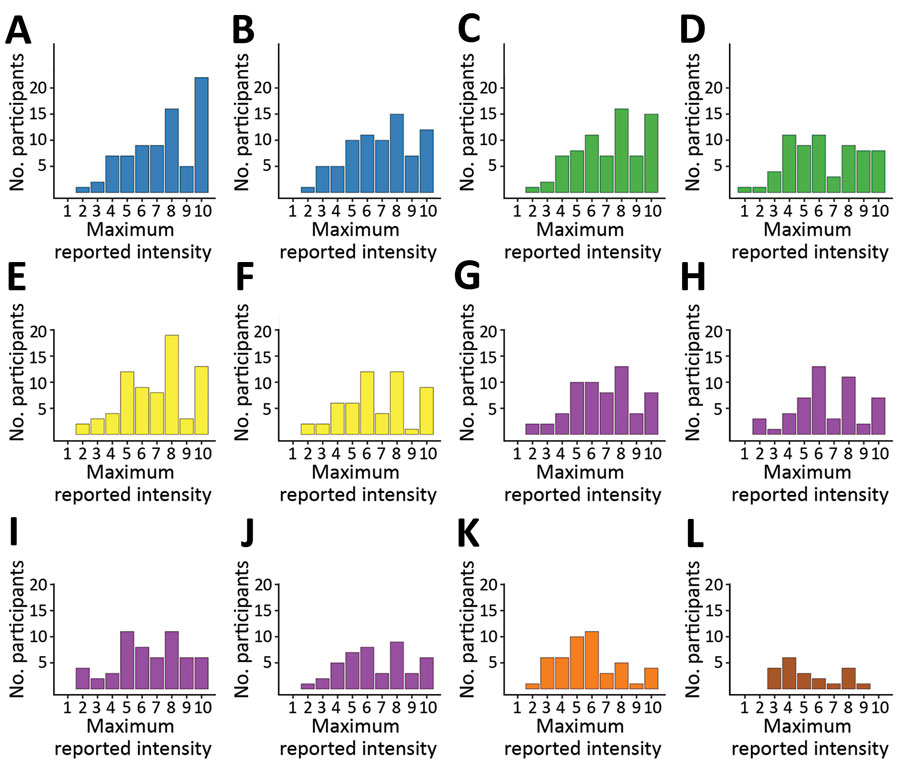
Histograms of maximum reported symptom intensities for participants tested for heterogeneity of dengue illness in community-based prospective study, Iquitos, Peru. Persons who did not report symptoms were excluded. Colors in histograms correspond to symptom groups defined in Figure 1. Values for each panel are no. (%) of participants who reported the specific symptom at any time during their illness. A) malaise, 78 (98.7); B) weakness, 76 (96.2); C) fever, 74 (93.7); D) chills, 65 (82.3); E) hea

Figure 2. Histograms of maximum reported symptom intensities for participants tested for heterogeneity of dengue illness in community-based prospective study, Iquitos, Peru. Persons who did not report symptoms were excluded. Colors in histograms correspond to symptom groups defined in Appendix Figure 1. Values for each panel are no. (%) of participants who reported the specific symptom at any time during their illness. A) malaise, 78 (98.7); B) weakness, 76 (96.2); C) fever, 74 (93.7); D) chills, 65 (82.3); E) headache, 72 (91.1); F) retroorbital pain, 54 (68.4); G) body pain, 61 (77.2); H) bone pain, 51 (64.6); I) muscle pain, 57 (72.2); J) joint pain, 45 (57.0); K) abdominal pain, 47 (59.5); L) sore throat, 21 (26.6).

Main Article

Page created: June 03, 2020
Page updated: August 18, 2020
Page reviewed: August 18, 2020
The conclusions, findings, and opinions expressed by authors contributing to this journal do not necessarily reflect the official position of the U.S. Department of Health and Human Services, the Public Health Service, the Centers for Disease Control and Prevention, or the authors' affiliated institutions. Use of trade names is for identification only and does not imply endorsement by any of the groups named above.
file_external