Skip directly to site content Skip directly to page options Skip directly to A-Z link Skip directly to A-Z link Skip directly to A-Z link
Volume 27, Number 1—January 2021
Research

Human Diversity of Killer Cell Immunoglobulin-Like Receptors and Human Leukocyte Antigen Class I Alleles and Ebola Virus Disease Outcomes

Tony Wawina-Bokalanga, Bert Vanmechelen, Valentine Lhermitte, Joan Martí-Carreras, Valentijn Vergote, Fara Raymond Koundouno, Joseph Akoi-Boré, Ruth Thom, Tom Tipton, Kimberley Steeds, Kéita Balla Moussa, Ablam Amento, Lies Laenen, Sophie Duraffour, Martin Gabriel, Paula Ruibal, Yper Hall, Mandy Kader-Kondé, Stephan Günther, Guy Baele, Cesar Muñoz-Fontela, Johan Van Weyenbergh, Miles W. Carroll, and Piet MaesComments to Author 
Author affiliations: KU Leuven, Leuven, Belgium (T. Wawina-Bokalanga, B. Vanmechelen, V. Lhermitte, J. Martí-Carreras, V. Vergote, L. Laenen, G. Baele, J. Van Weyenbergh, P. Maes); University Julius Nyerere of Kankan, Conakry, Guinea (F.R. Koudouno); Institut National de Santé Publique, Conakry (J. Akoi-Boré); Public Health England, Salisbury, UK (R. Thom, T. Tipton, K. Steeds, Y. Hall, M.W. Carroll); Centre d'Excellence de Formation et Recherche sur les Maladies Prioritaires en Guinée, Conakry (K.B. Moussa, A. Amento, M. Kader-Kondé); German Center for Infection Research, Hamburg-Lübeck-Borstel-Riems, Germany (S. Duraffour, M. Gabriel); Bernhard Nocht Institute for Tropical Medicine, Hamburg, Germany (S. Duraffour, M. Gabriel, P. Ruibal, S. Günther, C. Muñoz-Fontela)

Main Article

Figure 2

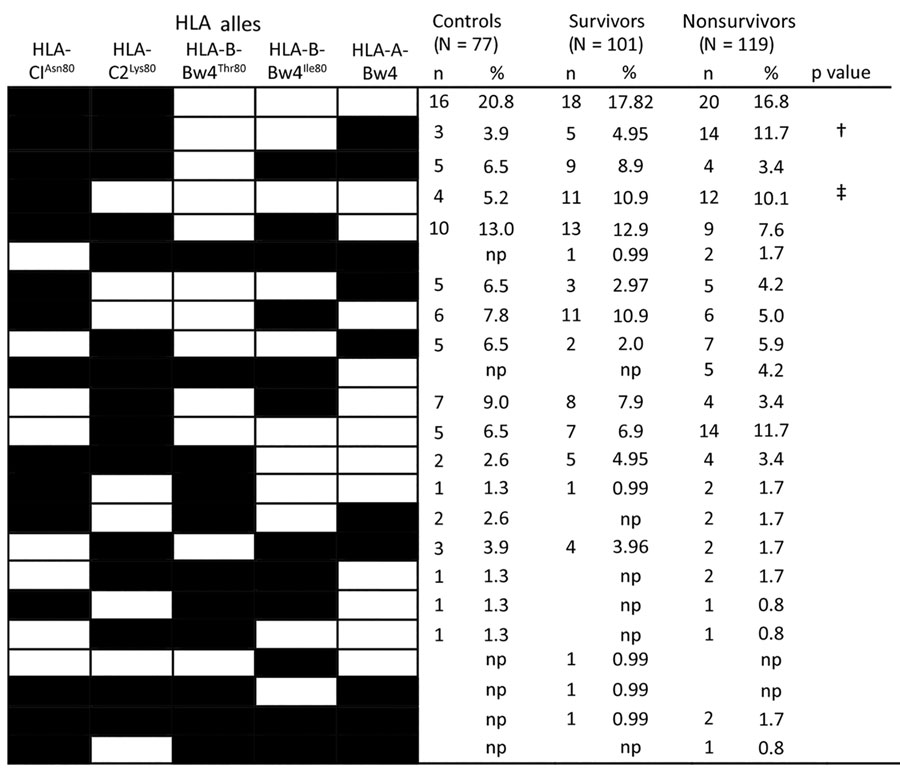
HLA haplotypes identified among the control group, Ebola survivors, and persons who died of Ebola virus disease in Guinea, 2015–2017. Percentage of each haplotype was calculated and defined as the number of persons with the HLA haplotype (n) divided by the number of individuals (N) in the studied group. Black boxes indicate presence of genes; white boxes indicate absence of genes. †p<Pc (survivors vs fatalities); ‡p<Pc (controls vs infected cases). HLA, human leukocyte antigen; NP, not present; Pc, corrected p value.

Figure 2. HLA haplotypes identified among the control group, Ebola survivors, and persons who died of Ebola virus disease in Guinea, 2015–2017. Percentage of each haplotype was calculated and defined as the number of persons with the HLA haplotype (n) divided by the number of individuals (N) in the studied group. Black boxes indicate presence of genes; white boxes indicate absence of genes. †p<Pc (survivors vs fatalities); ‡p<Pc (controls vs infected cases). HLA, human leukocyte antigen; NP, not present; Pc, corrected p value.

Main Article

Page created: October 16, 2020
Page updated: December 21, 2020
Page reviewed: December 21, 2020
The conclusions, findings, and opinions expressed by authors contributing to this journal do not necessarily reflect the official position of the U.S. Department of Health and Human Services, the Public Health Service, the Centers for Disease Control and Prevention, or the authors' affiliated institutions. Use of trade names is for identification only and does not imply endorsement by any of the groups named above.
file_external