Detection of Norovirus Variant GII.4 Hong Kong in Asia and Europe, 2017−2019
Martin Chi-Wai Chan
1, Sunando Roy, Joseph Bonifacio, Lin-Yao Zhang, Preeti Chhabra, Jenny C.M. Chan, Cristina Celma, Mary Ann Igoy, Sin-Leung Lau, Kirran N. Mohammad, Jan Vinjé, Harry Vennema, Judith Breuer, Marion Koopmans, Miranda de Graaf

, and
for NOROPATROL2
Author affiliations: The Chinese University of Hong Kong, Hong Kong, China (M.C.-W. Chan, L.-Y. Zhang, J.C.M. Chan, S.-L. Lau, K.N. Mohammad); University College London, London, UK (S. Roy, J. Breuer); Research Institute for Tropical Medicine, Muntinlupa City, the Philippines (J. Bonifacio, M.A. Igoy); Centers for Disease Control and Prevention, Atlanta, Georgia, USA (P. Chhabra, J. Vinjé); Public Health England, London (C. Celma); National Institute for Public Health and the Environment, Bilthoven, the Netherlands (H. Vennema); Erasmus Medical Center, Rotterdam, the Netherlands (M. Koopmans, M. de Graaf)
Main Article
Figure 2

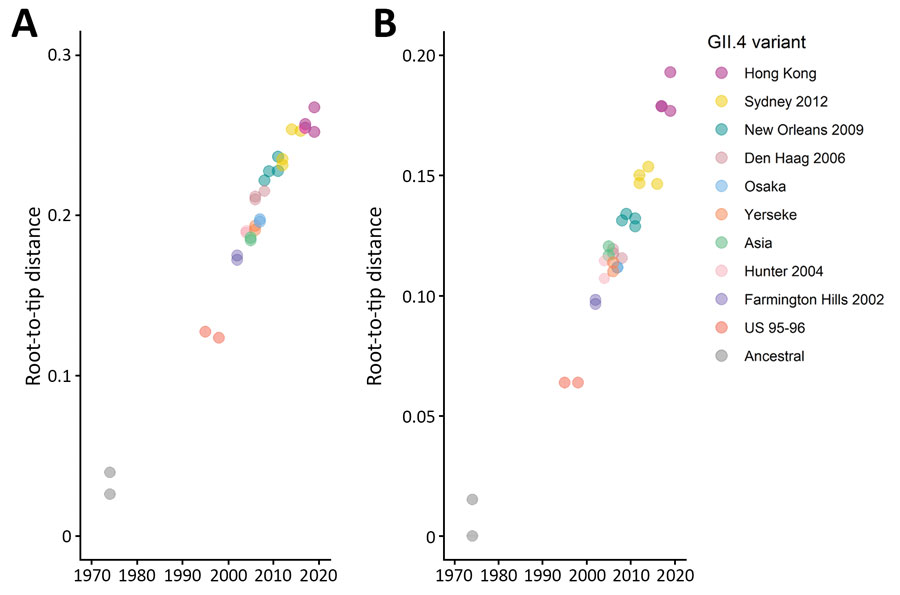
Figure 2. Root-to-tip distance plots of the major capsid protein nucleotide (A) and amino acid (B) sequences of norovirus GII.4 variants. Distance from best-fitting root was calculated using the corresponding maximum-likelihood phylogenetic tree shown in Figure 1. Each circle represents 1 strain color-coded by GII.4 variant; darker shades of color indicate >2 strains of the same variant. R2 values indicate the linearity of the accumulation of virus mutations over time; for nucleotide sequences, R2 = 0.9691, and for amino acid sequences, R2 = 0.9362. An identical set of sequences were used in phylogenetic inference and root-to-tip distance estimation.
Main Article
Page created: November 19, 2020
Page updated: December 21, 2020
Page reviewed: December 21, 2020
The conclusions, findings, and opinions expressed by authors contributing to this journal do not necessarily reflect the official position of the U.S. Department of Health and Human Services, the Public Health Service, the Centers for Disease Control and Prevention, or the authors' affiliated institutions. Use of trade names is for identification only and does not imply endorsement by any of the groups named above.
