Volume 27, Number 10—October 2021
Research
Severe Acute Respiratory Syndrome Coronavirus 2 Transmission in Georgia, USA, February 1–July 13, 2020
Figure 5
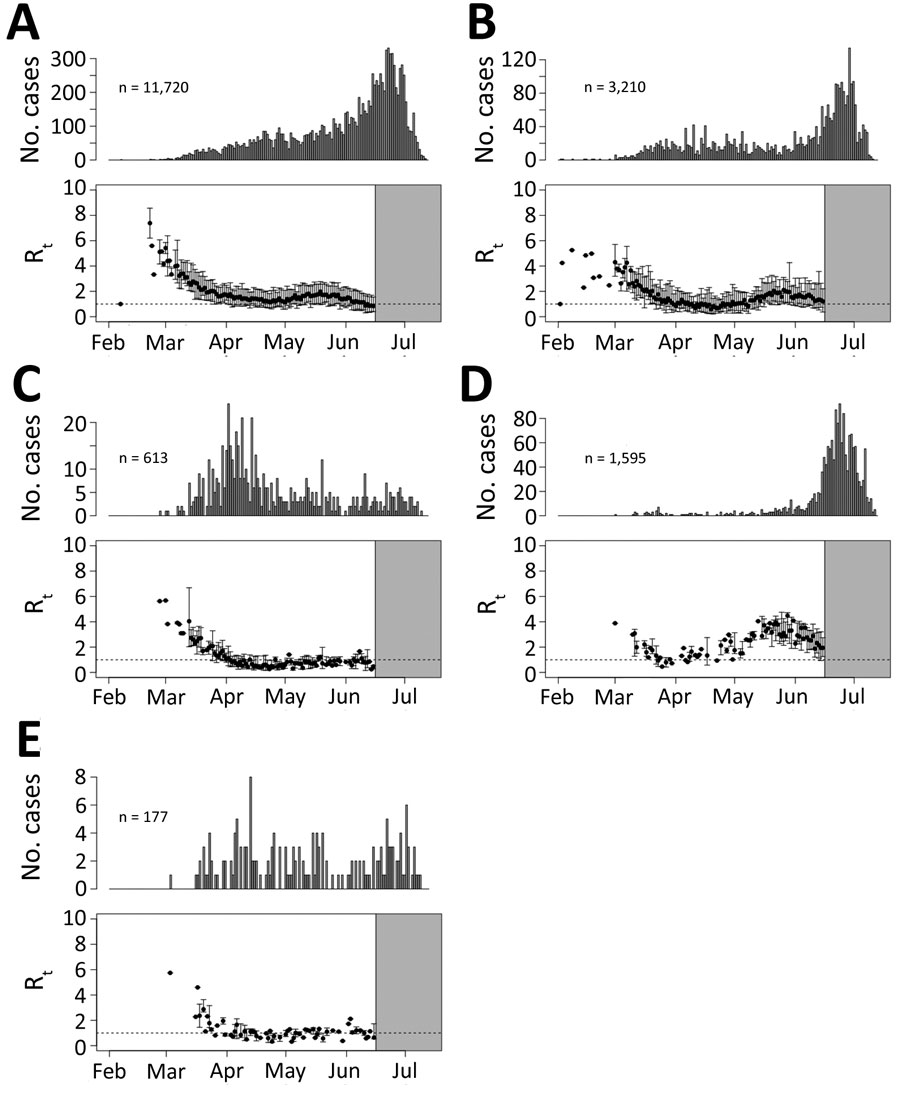
Figure 5. Examples of the 5 categories of severe acute respiratory syndrome coronavirus 2 spreading patterns in counties in Georgia, USA, February–July 2020. Shown are epidemic curves from the start of the outbreak until July 13, 2020, and effective reproduction number (Rt) estimates until June 15, in Gwinnett (A), Clayton (B), Sumter (C), Glynn (D), and Dawson (E) Counties. Tick marks indicate the first day of the month. The x-axis represents the date of symptom onset for patients with confirmed cases. The y-axis in the top plot shows the number of cases; the y-axis in the bottom plot shows the estimated median reproduction numbers. Error bars represent 2.5th–97.5th percentile ranges of Rts. The gray area shows where Rt estimates were truncated on June 15.