Volume 27, Number 10—October 2021
Research
Severe Acute Respiratory Syndrome Coronavirus 2 Transmission in Georgia, USA, February 1–July 13, 2020
Yuke Wang , Casey Siesel, Yangping Chen, Ben Lopman, Laura Edison, Michael Thomas, Carly Adams, Max Lau, and Peter F.M. Teunis
Figure 6
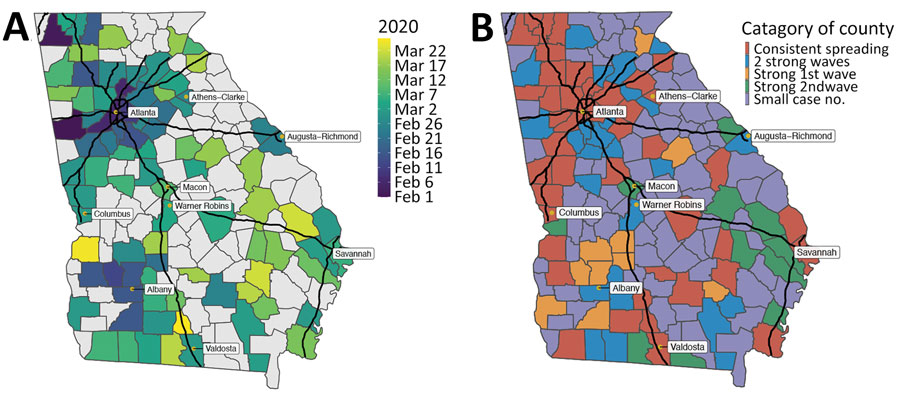
Figure 6. Spatial patterns of transmission of severe acute respiratory syndrome coronavirus 2 in Georgia, USA, February–July 2020. A) Date of reaching the peak (local maximum of effective reproduction number) for the first wave; B) spatial distribution of the 5 categories of virus transmission patterns by June 15, 2020. The black lines represent interstate highways.
Page created: July 30, 2021
Page updated: September 19, 2021
Page reviewed: September 19, 2021
The conclusions, findings, and opinions expressed by authors contributing to this journal do not necessarily reflect the official position of the U.S. Department of Health and Human Services, the Public Health Service, the Centers for Disease Control and Prevention, or the authors' affiliated institutions. Use of trade names is for identification only and does not imply endorsement by any of the groups named above.