Volume 27, Number 10—October 2021
Research
Risk Assessment for Highly Pathogenic Avian Influenza A(H5N6/H5N8) Clade 2.3.4.4 Viruses
Figure
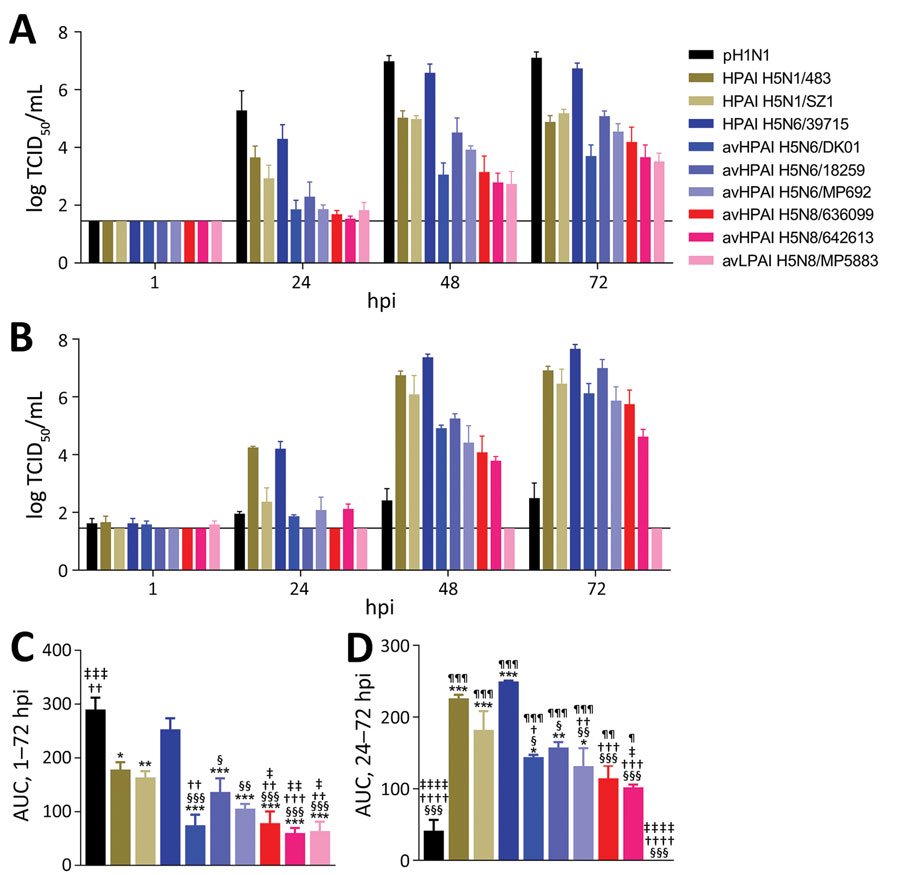
Figure. Replication kinetics of influenza A viruses. A, B) Replication in human airway organoids infected with 6 log TCID50/mL virus (A) and primary human alveolar epithelial cells infected at multiplicity of infection 0.01 at 37°C (B). Virus titers in culture medium (mean ± SEM, n>3) were determined by TCID50 assays with a detection limit of 1.5 log TCID50/mL, denoted by a solid line. Statistical significance between virus titers at each time point after infection is provided in Appendix 1 Figure. C, D) The areas under the replication kinetic curves above the detection limit in human airway organoids from 1 to 72 hpi (C) and alveolar epithelial cells from 24 to 72 hpi (mean ± SEM, n >3) (D). Statistical significance between AUC values was analyzed by using 1-way analysis of variance with Bonferroni posttests. *p<0.01; **p<0.001; ***p<0.0001 (compared with pH1N1); †p<0.05; ††p<0.01; †††p<0.001; ††††p< 0.0001 (compared with HPAI H5N1/483); ‡p<0.05; ‡‡p<0.01; ‡‡‡p< 0.001; ‡‡‡‡p<0.0001 (compared with HPAI H5N1/SZ1); §p<0.01; §§p<0.001; §§§ p<0.0001 (compared with HPAI H5N6/39715); ¶p<0.01; ¶¶p< 0.001; ¶¶¶p<0.0001 (compared with avLPAI H5N8/MP5883). AUC, area under the curve; av, avian; HPAI, highly pathogenic avian influenza; hpi, hours postinfection; LPAI, low pathogenicity avian influenza; pH1N1, influenza A(H1N1)pdm09 virus; TCID50, 50% tissue culture infectious dose.
1These first authors contributed equally to this article.