Skip directly to site content Skip directly to page options Skip directly to A-Z link Skip directly to A-Z link Skip directly to A-Z link
Volume 27, Number 11—November 2021
Dispatch

Prevalence of SARS-CoV-2 Antibodies after First 6 Months of COVID-19 Pandemic, Portugal

Luísa Canto e Castro, Ana Helena Guia Pereira, Rita Ribeiro, Catarina Alves, Luís Veloso, Vera Vicente, Dalila Alves, Inês Domingues, Cláudia Silva, Andreia Gomes, Marta Serrano, Ângela Afonso, Marc Veldhoen, Maria José Rego de Sousa, José Germano Rego de Sousa, Germano de Sousa, Maria M. Mota, Bruno Silva-Santos1, and Ruy M. Ribeiro1Comments to Author 
Author affiliations: Fundação Francisco Manuel dos Santos, Lisbon, Portugal (L. Canto e Castro); Universidade de Lisboa, Lisbon (L. Canto e Castro, I. Domingues, C. Silva, A. Gomes, M. Serrano, Â. Afonso, M. Veldhoen, M.M. Mota, B. Silva-Santos, R.M. Ribeiro); Centro de Medicina Laboratorial Germano de Sousa, Lisbon (A.H.G. Pereira, R. Ribeiro, M.J. Rego de Sousa, J.G. Rego de Sousa, G. de Sousa); CTI Clinical Trial and Consulting Services, Portugal (C. Alves, L. Veloso, V. Vicente, D. Alves); Los Alamos National Laboratory, Los Alamos, New Mexico, USA (R.M. Ribeiro)

Main Article

Figure 1

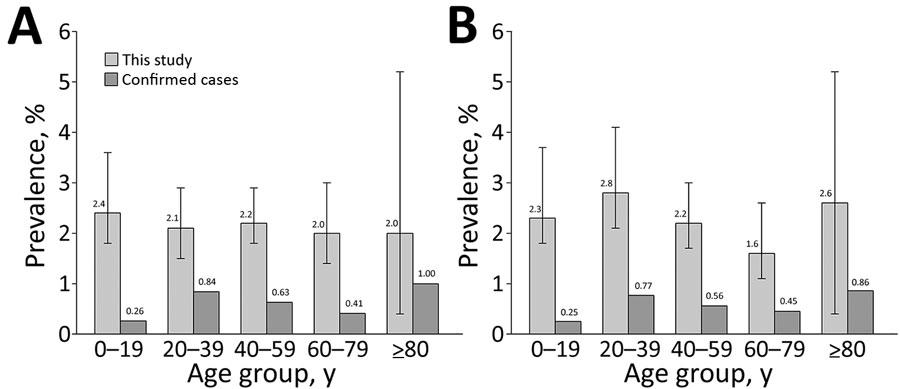
Seroprevalence of antibodies against severe acute respiratory syndrome coronavirus 2, Portugal, compared with official reported confirmed cases, by sex and age. A) Female; B) male. Adjusted seroprevalence measured in this study (numbers above light gray bars) is compared with confirmed cases (numbers above dark gray bars) as a fraction of the corresponding population group (on September 1, 2020). Error bars indicate 95% CIs for estimates. This figure includes different age ranges for consistency with the official data on number of cases by age.

Figure 1. Seroprevalence of antibodies against severe acute respiratory syndrome coronavirus 2, Portugal, compared with official reported confirmed cases, by sex and age. A) Female; B) male. Adjusted seroprevalence measured in this study (numbers above light gray bars) is compared with confirmed cases (numbers above dark gray bars) as a fraction of the corresponding population group (on September 1, 2020). Error bars indicate 95% CIs for estimates. This figure includes different age ranges for consistency with the official data on number of cases by age.

Main Article

1These authors were co-senior authors.

Page created: August 10, 2021
Page updated: October 19, 2021
Page reviewed: October 19, 2021
The conclusions, findings, and opinions expressed by authors contributing to this journal do not necessarily reflect the official position of the U.S. Department of Health and Human Services, the Public Health Service, the Centers for Disease Control and Prevention, or the authors' affiliated institutions. Use of trade names is for identification only and does not imply endorsement by any of the groups named above.
file_external