Skip directly to site content Skip directly to page options Skip directly to A-Z link Skip directly to A-Z link Skip directly to A-Z link
Volume 27, Number 2—February 2021
Research

Effects of Social Distancing Measures during the First Epidemic Wave of Severe Acute Respiratory Syndrome Infection, Greece

Vana SypsaComments to Author , Sotirios Roussos, Dimitrios Paraskevis, Theodore Lytras, Sotirios Tsiodras1, and Angelos Hatzakis1
Author affiliations: National and Kapodistrian University of Athens, Athens, Greece (V. Sypsa, S. Roussos, D. Paraskevis, S. Tsiodras, A. Hatzakis); National Public Health Organization, Athens (T. Lytras); European University Cyprus, Nicosia, Cyprus (T. Lytras)

Main Article

Figure 5

The percentage of decline of R0 associated with multiple social distancing measures during coronavirus disease lockdown in Greece and the relative contribution of each measure or combination of measures implemented. Boxplots demonstrate distribution of the estimated percent decline from nonparametric bootstrap on the social contacts data based on 1,000 bootstrap samples. R0 reduction during lockdown was obtained by comparing social contacts data collected for April 2020 versus January 2020. The other estimates were derived by using the information from contact diaries in January 2020 corresponding to a regular school or work day and excluding or reducing subsets of social contacts at school, work, home, and leisure activities, based on observations during lockdown. Because contact with a particular person can take place in multiple settings, we assigned contacts at multiple locations to a single location by using the following hierarchical order: home, work, school, leisure activities, transportation, and other locations. Dotted line indicates the minimum reduction needed to bring R0 from 2.38 to <1. Box top and bottom lines indicate 25th and 75th percentiles; horizontal lines within boxes indicate medians; whiskers indicate 25th/75th percentile plus 1.5 times the interquartile range. R0, basic reproduction number.

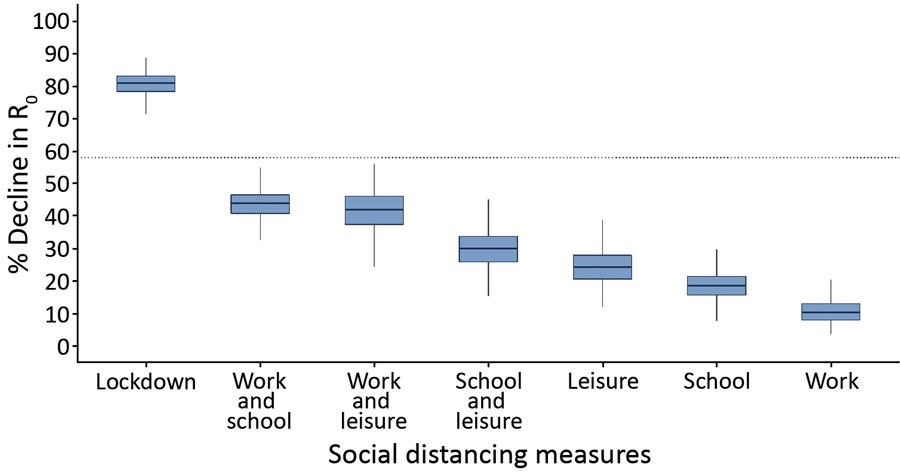
Figure 5. The percentage of decline of R0 associated with multiple social distancing measures during coronavirus disease lockdown in Greece and the relative contribution of each measure or combination of measures implemented. Boxplots demonstrate distribution of the estimated percent decline from nonparametric bootstrap on the social contacts data based on 1,000 bootstrap samples. R0 reduction during lockdown was obtained by comparing social contacts data collected for April 2020 versus January 2020. The other estimates were derived by using the information from contact diaries in January 2020 corresponding to a regular school or work day and excluding or reducing subsets of social contacts at school, work, home, and leisure activities, based on observations during lockdown. Because contact with a particular person can take place in multiple settings, we assigned contacts at multiple locations to a single location by using the following hierarchical order: home, work, school, leisure activities, transportation, and other locations. Dotted line indicates the minimum reduction needed to bring R0 from 2.38 to <1. Box top and bottom lines indicate 25th and 75th percentiles; horizontal lines within boxes indicate medians; whiskers indicate 25th/75th percentile plus 1.5 times the interquartile range. R0, basic reproduction number.

Main Article

1These senior authors contributed equally to this article.

Page created: December 14, 2020
Page updated: January 23, 2021
Page reviewed: January 23, 2021
The conclusions, findings, and opinions expressed by authors contributing to this journal do not necessarily reflect the official position of the U.S. Department of Health and Human Services, the Public Health Service, the Centers for Disease Control and Prevention, or the authors' affiliated institutions. Use of trade names is for identification only and does not imply endorsement by any of the groups named above.
file_external