Decentralized Care for Rifampin-Resistant Tuberculosis, Western Cape, South Africa
Sarah V. Leavitt

, Karen R. Jacobson, Elizabeth J. Ragan, Jacob Bor, Jennifer Hughes, Tara C. Bouton, Tania Dolby, Robin M. Warren, and Helen E. Jenkins
Author affiliations: Boston University, Boston, Massachusetts, USA (S.V. Leavitt, K.R. Jacobson, E.J. Ragan, J. Bor, T.C. Bouton, H.E. Jenkins); Boston Medical Center, Boston (K.R. Jacobson, E.J. Ragan, T.C. Bouton); University of the Witwatersrand, Johannesburg, South Africa (J. Bor); Stellenbosch University, Stellenbosch, South Africa (J. Hughes, R.M. Warren); Brown University, Providence, Rhode Island, USA (T.C. Bouton); Green Point Tuberculosis Laboratory, Cape Town, South Africa (T. Dolby); South African Medical Research Council Centre for Tuberculosis Research, Cape Town (R.M. Warren); Department of Science and Technology–National Research Foundation Centre of Excellence for Biomedical Tuberculosis Research, Cape Town (R.M. Warren)
Main Article
Figure 3
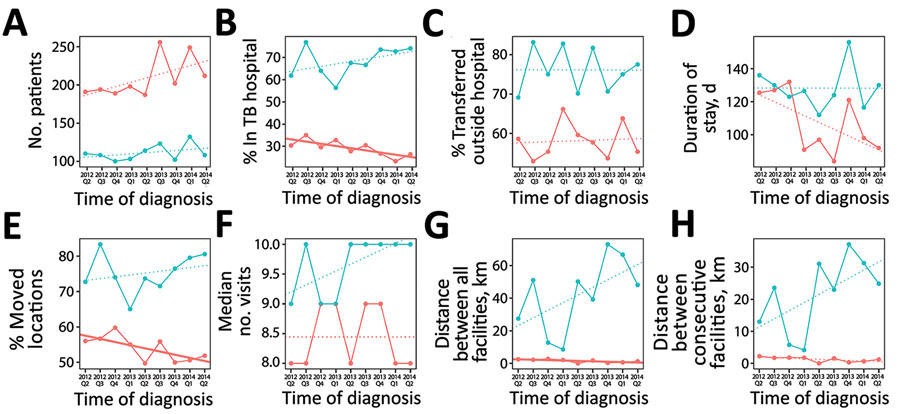
Figure 3. Linear time trends in magnitude and duration of movement for adult patients with RR TB, Western Cape, South Africa, 2012–2014. Patients did not have second-line drug resistance and attended >2 clinic visits. Linear regression trendlines are colored based on district of diagnosis (red indicates Cape Town; blue indicates other districts) and styled based on significance (solid line indicates p<0.05; dotted line indicates p>0.05). A) Number of patients diagnosed with RR TB. B) Percentage of patients who submitted a sample from a TB hospital <1 year after diagnosis. C) Percentage of patients who transitioned to care outside a TB hospital. D) Median duration of first stay in a TB hospital. E) Percentage of patients who transitioned to different facilities. F) Median number of visits in which patient submitted >1 sample. G) Median total Euclidean distance traveled between locations. H) Median Euclidean distance between consecutive visits. RR, rifampin-resistant; TB, tuberculosis.
Main Article
Page created: January 29, 2021
Page updated: February 21, 2021
Page reviewed: February 21, 2021
The conclusions, findings, and opinions expressed by authors contributing to this journal do not necessarily reflect the official position of the U.S. Department of Health and Human Services, the Public Health Service, the Centers for Disease Control and Prevention, or the authors' affiliated institutions. Use of trade names is for identification only and does not imply endorsement by any of the groups named above.