Volume 27, Number 5—May 2021
Research
Use of Genomics to Track Coronavirus Disease Outbreaks, New Zealand
Jemma L. Geoghegan1 , Jordan Douglas1, Xiaoyun Ren, Matthew Storey, James Hadfield, Olin K. Silander, Nikki E. Freed, Lauren Jelley, Sarah Jefferies, Jillian Sherwood, Shevaun Paine, Sue Huang, Andrew Sporle, Michael G. Baker, David R. Murdoch, Alexei J. Drummond, David Welch, Colin R. Simpson, Nigel French, Edward C. Holmes, and Joep de Ligt
Figure 2
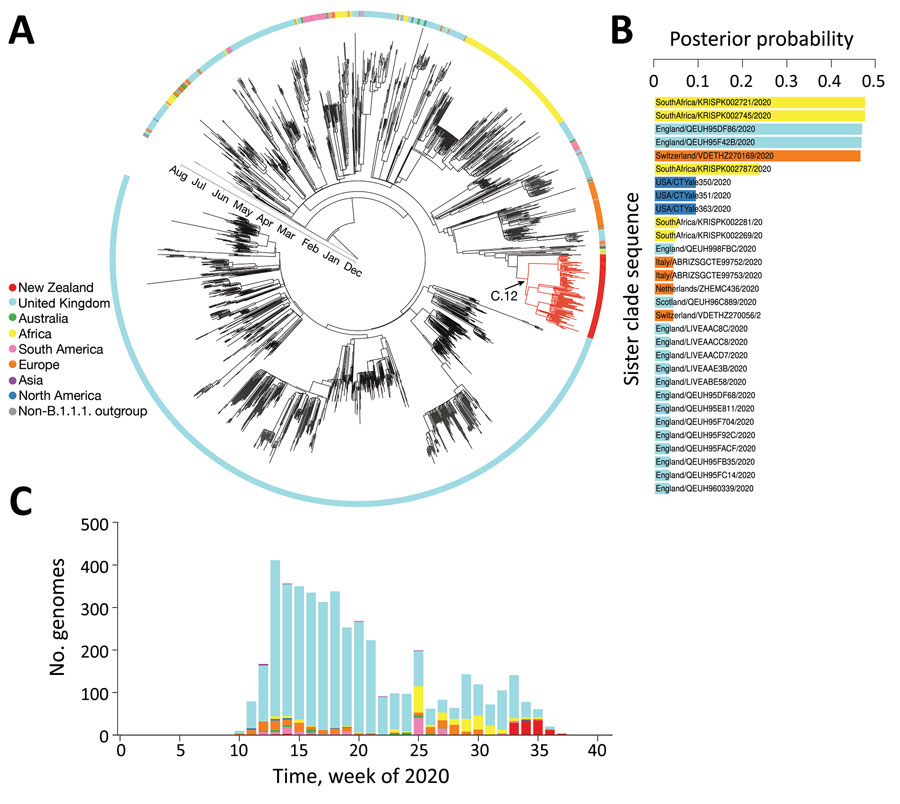
Figure 2. Genomic sequence analyses of global severe acute respiratory syndrome coronavirus 2 isolates. A) Maximum-clade credibility phylogenetic tree of 2,000 subsampled global genomes (1,996 most recently sampled B.1.1.1. plus 4 non-B.1.1.1. used as an outgroup) with an outer ring colored by sampling region. B) Posterior probability of genomes within the sister clade to that of the August 2020 outbreak in New Zealand, color coded by sampling location. C) Proportion of genomes within lineage B.1.1.1. in the global dataset over time, color-coded by sampling location.
1These authors contributed equally to this article.
Page created: March 09, 2021
Page updated: April 20, 2021
Page reviewed: April 20, 2021
The conclusions, findings, and opinions expressed by authors contributing to this journal do not necessarily reflect the official position of the U.S. Department of Health and Human Services, the Public Health Service, the Centers for Disease Control and Prevention, or the authors' affiliated institutions. Use of trade names is for identification only and does not imply endorsement by any of the groups named above.