Skip directly to site content Skip directly to page options Skip directly to A-Z link Skip directly to A-Z link Skip directly to A-Z link
Volume 27, Number 7—July 2021
Research

Fatal Human Infection with Evidence of Intrahost Variation of Eastern Equine Encephalitis Virus, Alabama, USA, 2019

Holly R. HughesComments to Author , Jason O. Velez, Emily H. Davis, Janeen Laven, Carolyn V. Gould, Amanda J. Panella, Amy J. Lambert, J. Erin Staples, and Aaron C. Brault
Author affiliation: Centers for Disease Control and Prevention, Fort Collins, Colorado, USA

Main Article

Figure 1

Maximum-likelihood phylogeny of eastern equine encephalitis virus from a woman in Alabama, USA, 2019 (solid circles), and reference sequences, based on complete coding region sequences. Nucleotide coding sequences of the full genome of eastern equine encephalitis viruses isolated during 1951–2019 were codon aligned and phylogenies inferred with general time reversible plus gamma plus proportion of invariable sites. Taxa are labeled with year of isolation, host, US state of isolation, and GenBank accession number. Branches are labeled with bootstrap support values as a percentage of 1,000 replicates. Branches with <50% bootstrap support are collapsed; only branches with >60% support are labeled. Branch lengths are drawn to scale and measured in the number of substitutions per site.

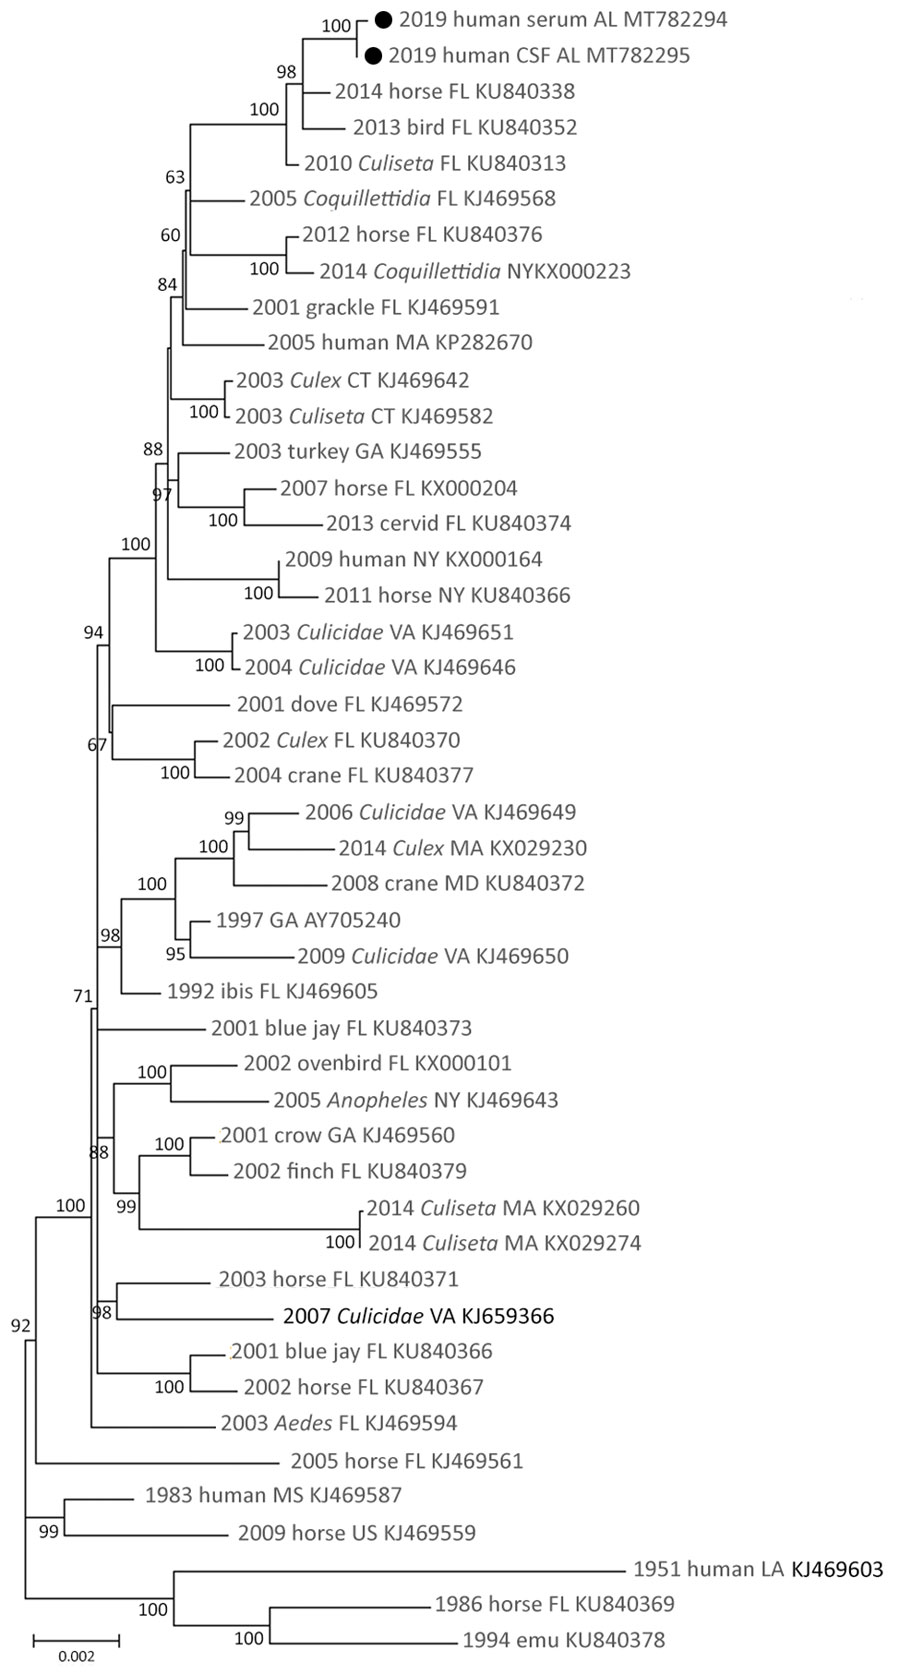
Figure 1. Maximum-likelihood phylogeny of eastern equine encephalitis virus from a woman in Alabama, USA, 2019 (solid circles), and reference sequences, based on complete coding region sequences. Nucleotide coding sequences of the full genome of eastern equine encephalitis viruses isolated during 1951–2019 were codon aligned and phylogenies inferred with general time reversible plus gamma plus proportion of invariable sites. Taxa are labeled with year of isolation, host, US state of isolation, and GenBank accession number. Branches are labeled with bootstrap support values as a percentage of 1,000 replicates. Branches with <50% bootstrap support are collapsed; only branches with >60% support are labeled. Branch lengths are drawn to scale and measured in the number of substitutions per site.

Main Article

Page created: May 14, 2021
Page updated: June 16, 2021
Page reviewed: June 16, 2021
The conclusions, findings, and opinions expressed by authors contributing to this journal do not necessarily reflect the official position of the U.S. Department of Health and Human Services, the Public Health Service, the Centers for Disease Control and Prevention, or the authors' affiliated institutions. Use of trade names is for identification only and does not imply endorsement by any of the groups named above.
file_external