Skip directly to site content Skip directly to page options Skip directly to A-Z link Skip directly to A-Z link Skip directly to A-Z link
Volume 27, Number 9—September 2021
Research

Estimating the Impact of Statewide Policies to Reduce Spread of Severe Acute Respiratory Syndrome Coronavirus 2 in Real Time, Colorado, USA

Andrea G. Buchwald1, Jude Bayham, Jimi Adams, David Bortz, Kathryn Colborn, Olivia Zarella, Meghan Buran, Jonathan Samet, Debashis Ghosh, Rachel Herlihy, and Elizabeth J. CarltonComments to Author 
Author affiliations: Colorado School of Public Health, Aurora, Colorado, USA (A.G. Buchwald, O. Zarella, M. Buran, J. Samet, D. Ghosh, E.J. Carlton); Colorado State University, Fort Collins, Colorado, USA (J. Bayham); University of Colorado, Denver, Colorado, USA (J. Adams); University of Colorado, Boulder, Colorado, USA (D. Bortz); University of Colorado School of Medicine, Aurora (K. Colborn); Colorado Department of Public Health and Environment, Denver (R. Herlihy)

Main Article

Figure 5

Projected coronavirus disease ICU needs, Colorado, USA, 2020, if current trajectory continues (black line) and for a range of social distancing scenarios (colored lines) generated by using models calibrated at 4 time points during April‒ June (fit 1: Apr 3; fit 2: April 16; fit 3: May 15; fit 4: June 16). Current trajectory was based on estimated parameters generated for each fit. Social distancing is modeled as a percent reduction in the contact rate from baseline, and changes in social distancing are introduced 2 weeks after model fitting date. All other fitted parameters are held at the estimated values for each fit. Because ICU estimates from fit 1 were substantially higher than for later fits, the y-axis is scaled to 20,000 as opposed to 10,000 for fits 2–4. Colorado estimated ICU capacity (1,800 beds) is indicated by the dashed gray horizontal line. ICU, intensive care unit. Numbers in parentheses are current values.

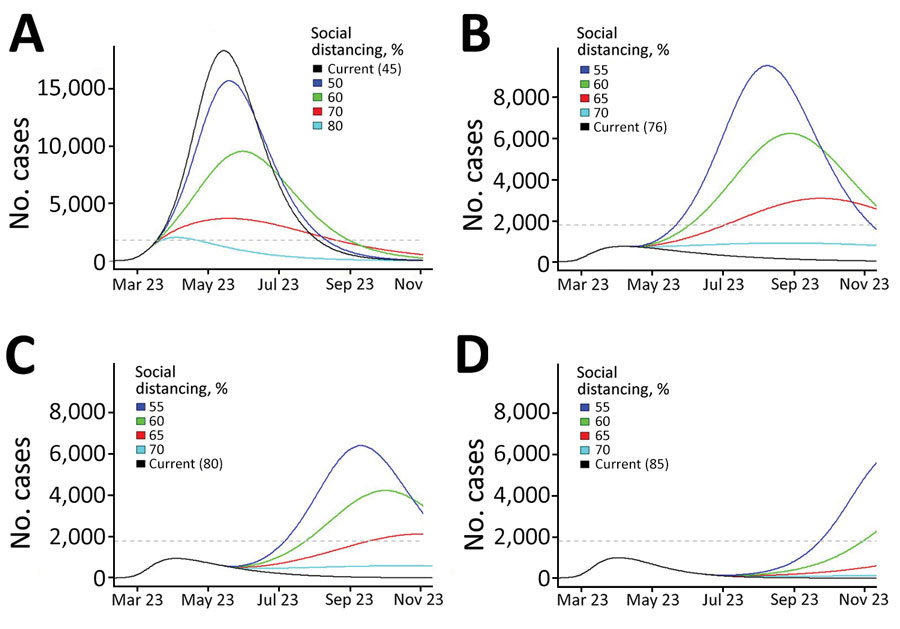
Figure 5. Projected coronavirus disease ICU needs, Colorado, USA, 2020, if current trajectory continues (black line) and for a range of social distancing scenarios (colored lines) generated by using models calibrated at 4 time points during April‒ June (fit 1: Apr 3; fit 2: April 16; fit 3: May 15; fit 4: June 16). Current trajectory was based on estimated parameters generated for each fit. Social distancing is modeled as a percent reduction in the contact rate from baseline, and changes in social distancing are introduced 2 weeks after model fitting date. All other fitted parameters are held at the estimated values for each fit. Because ICU estimates from fit 1 were substantially higher than for later fits, the y-axis is scaled to 20,000 as opposed to 10,000 for fits 2–4. Colorado estimated ICU capacity (1,800 beds) is indicated by the dashed gray horizontal line. ICU, intensive care unit. Numbers in parentheses are current values.

Main Article

1Current affiliation: University of Maryland School of Medicine, Baltimore, Maryland, USA.

Page created: June 02, 2021
Page updated: August 17, 2021
Page reviewed: August 17, 2021
The conclusions, findings, and opinions expressed by authors contributing to this journal do not necessarily reflect the official position of the U.S. Department of Health and Human Services, the Public Health Service, the Centers for Disease Control and Prevention, or the authors' affiliated institutions. Use of trade names is for identification only and does not imply endorsement by any of the groups named above.
file_external