Skip directly to site content Skip directly to page options Skip directly to A-Z link Skip directly to A-Z link Skip directly to A-Z link
Volume 27, Number 9—September 2021
Research

Estimating the Impact of Statewide Policies to Reduce Spread of Severe Acute Respiratory Syndrome Coronavirus 2 in Real Time, Colorado, USA

Andrea G. Buchwald1, Jude Bayham, Jimi Adams, David Bortz, Kathryn Colborn, Olivia Zarella, Meghan Buran, Jonathan Samet, Debashis Ghosh, Rachel Herlihy, and Elizabeth J. CarltonComments to Author 
Author affiliations: Colorado School of Public Health, Aurora, Colorado, USA (A.G. Buchwald, O. Zarella, M. Buran, J. Samet, D. Ghosh, E.J. Carlton); Colorado State University, Fort Collins, Colorado, USA (J. Bayham); University of Colorado, Denver, Colorado, USA (J. Adams); University of Colorado, Boulder, Colorado, USA (D. Bortz); University of Colorado School of Medicine, Aurora (K. Colborn); Colorado Department of Public Health and Environment, Denver (R. Herlihy)

Main Article

Figure 6

Changes in population mobility before and after emergence of coronavirus disease, Colorado, USA, 2020, and comparison between mobility and estimated social distancing. A) Changes in mobility measured by the number hours spent away from home per day (source: SafeGraph, https://www.safegraph.com). Gray line indicates daily observations, and black line indicates a smoothed line using locally estimated scatterplot smoothing in R (https://www.r-project.org). The ribbon at the bottom indicates the 4 social distancing phases. B) Comparison between susceptible-exposed-infected-recovered model-estimated social distancing (colored boxes) and reduction in mobility relative to the preintervention period, January 29–February 15 (colored lines). Colors correspond to the 4 social distancing phases. Reductions in mobility are calculated as percentage decreases in time away from home relative to pre-epidemic baseline. C) Observed hospitalization data (red) and the simulated hospitalizations based on time away from home relative to a baseline mean during January 29–February 15. In the simulation, it is assumed there is no self-isolation of symptomatic infectious, no mask wearing, and no other transmission reduction to highlight the role of the mobility data in the simulation. P, phase.

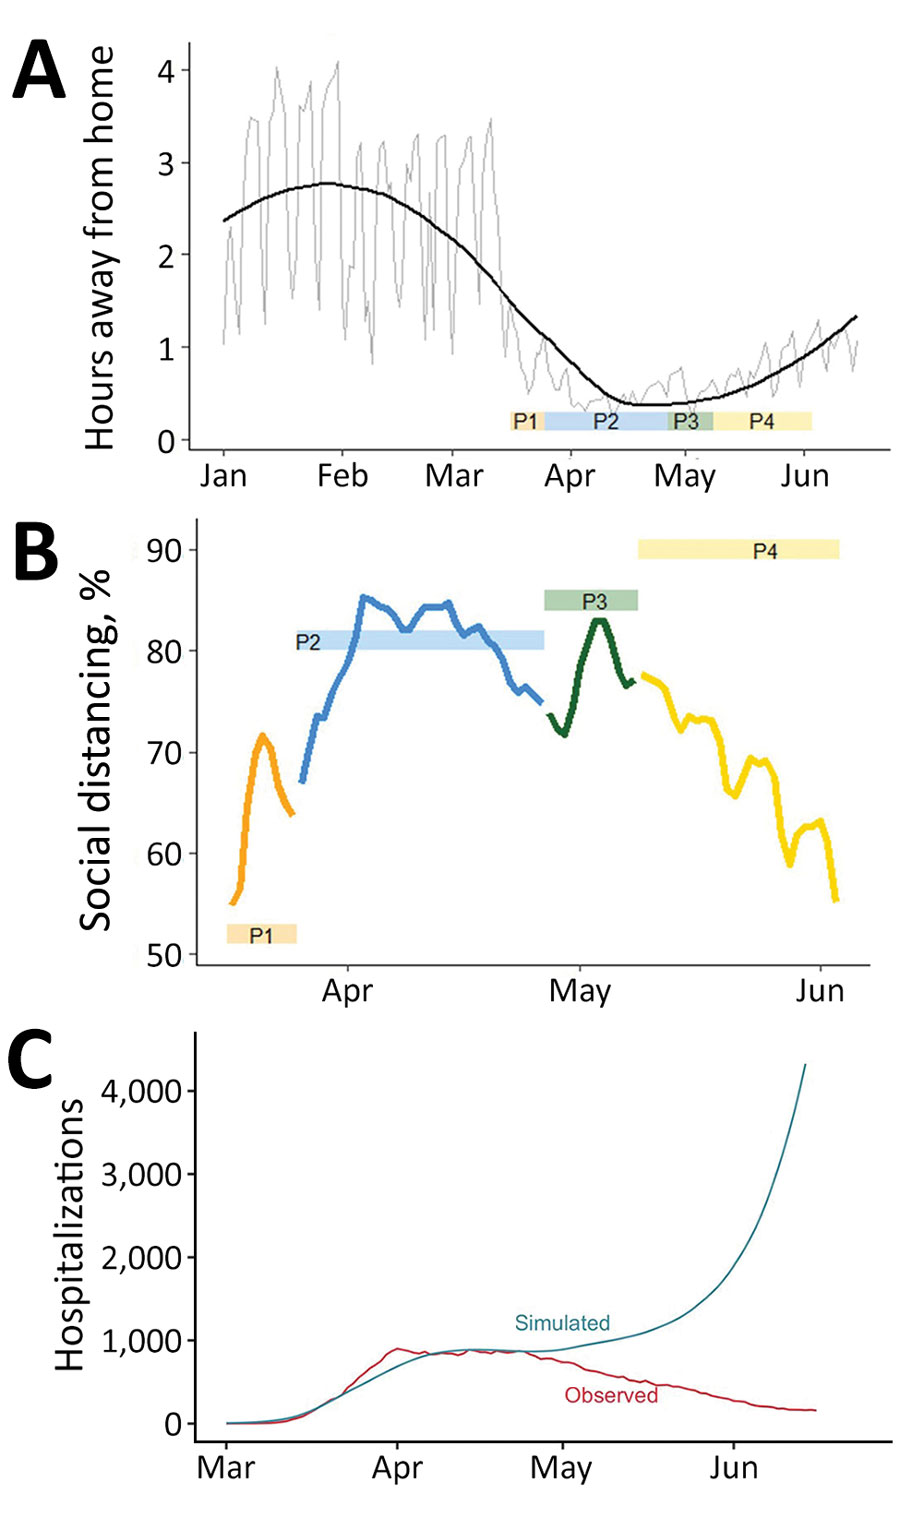
Figure 6. Changes in population mobility before and after emergence of coronavirus disease, Colorado, USA, 2020, and comparison between mobility and estimated social distancing. A) Changes in mobility measured by the number hours spent away from home per day (source: SafeGraph, https://www.safegraph.com). Gray line indicates daily observations, and black line indicates a smoothed line using locally estimated scatterplot smoothing in R (https://www.r-project.org). The ribbon at the bottom indicates the 4 social distancing phases. B) Comparison between susceptible-exposed-infected-recovered model-estimated social distancing (colored boxes) and reduction in mobility relative to the preintervention period, January 29–February 15 (colored lines). Colors correspond to the 4 social distancing phases. Reductions in mobility are calculated as percentage decreases in time away from home relative to pre-epidemic baseline. C) Observed hospitalization data (red) and the simulated hospitalizations based on time away from home relative to a baseline mean during January 29–February 15. In the simulation, it is assumed there is no self-isolation of symptomatic infectious, no mask wearing, and no other transmission reduction to highlight the role of the mobility data in the simulation. P, phase.

Main Article

1Current affiliation: University of Maryland School of Medicine, Baltimore, Maryland, USA.

Page created: June 02, 2021
Page updated: August 17, 2021
Page reviewed: August 17, 2021
The conclusions, findings, and opinions expressed by authors contributing to this journal do not necessarily reflect the official position of the U.S. Department of Health and Human Services, the Public Health Service, the Centers for Disease Control and Prevention, or the authors' affiliated institutions. Use of trade names is for identification only and does not imply endorsement by any of the groups named above.
file_external