Volume 28, Number 10—October 2022
Dispatch
Nosocomial COVID-19 Incidence and Secondary Attack Rates among Patients of Tertiary Care Center, Zurich, Switzerland
Aline Wolfensberger , Verena Kufner, Maryam Zaheri, Marius Zeeb, Isabelle Nortes, Peter W. Schreiber, Miriam Vazquez, Verena Schärer, Thomas Scheier, Stefan Schmutz, Elisabeth Probst, Dirk Saleschus, Michael Huber, Silvana K. Rampini, and Walter Zingg
Figure 2
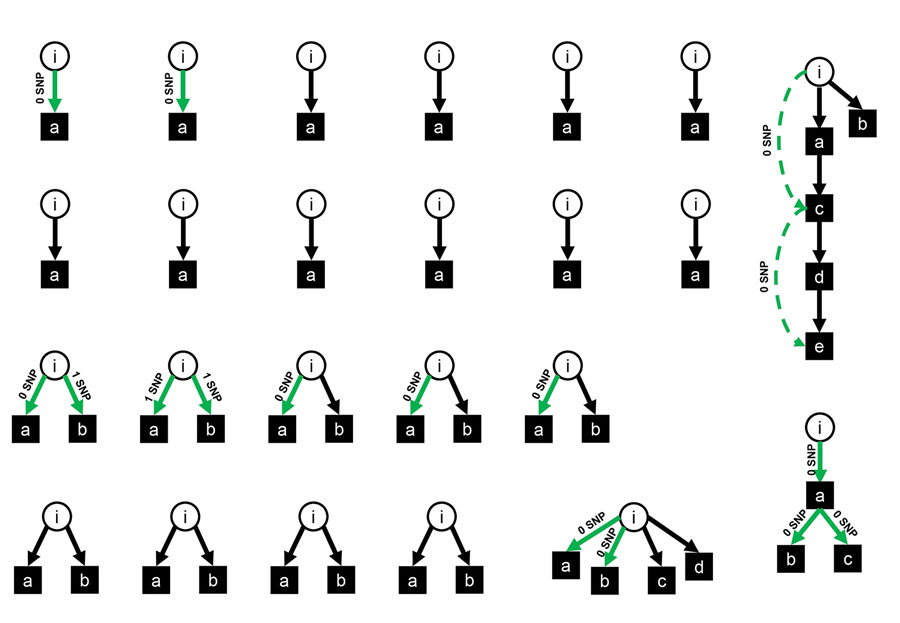
Figure 2. Transmission clusters of patients after exclusion of 5 exposed patients in whom phylogenetic data did not support transmission. Circles are index patients, squares are infected contact patients. Green arrows represent phylogenetically confirmed transmissions, with the labels “0 SNP” and “1 SNP” indicating 0 or 1 SNP difference between index and exposed patient. Green dashed arrows represent phylogenetic proof of second-generation transmission. Black arrows represent assumed transmissions without phylogenetic proof. i, index patient; a–d, exposed
Page created: July 31, 2022
Page updated: September 21, 2022
Page reviewed: September 21, 2022
The conclusions, findings, and opinions expressed by authors contributing to this journal do not necessarily reflect the official position of the U.S. Department of Health and Human Services, the Public Health Service, the Centers for Disease Control and Prevention, or the authors' affiliated institutions. Use of trade names is for identification only and does not imply endorsement by any of the groups named above.