Volume 28, Number 10—October 2022
Synopsis
Seasonality of Common Human Coronaviruses, United States, 2014–20211
Figure 2
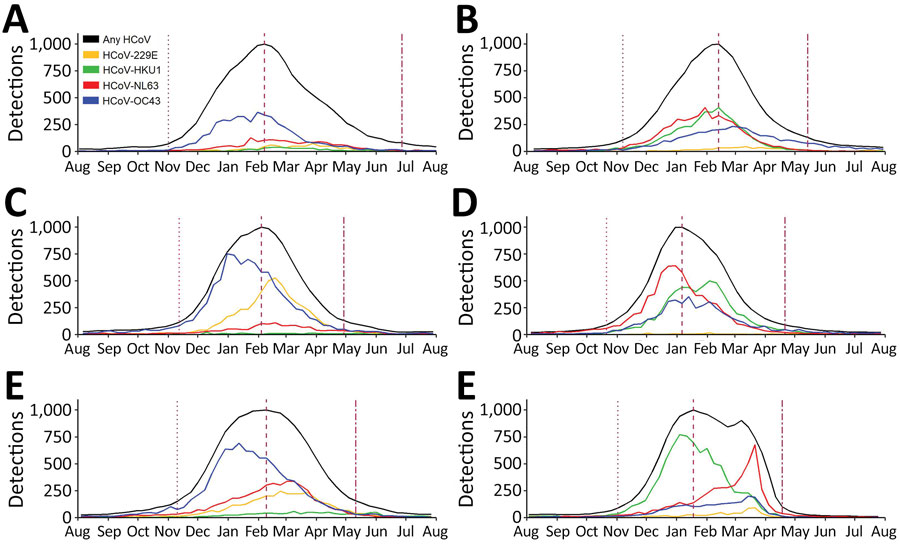
Figure 2. Total number of detections of the 4 common HCoVs, by week and season, from weekly aggregated data submitted to the National Respiratory and Enteric Virus Surveillance System, United States, July 2014–July 2020. The 3 vertical dotted lines, left to right, indicate the week of season onset, peak, and offset for all types combined (black line). These seasonal inflections were defined by using the retrospective slope 10 method, which uses a centered 5-week moving average of weekly detections with normalization to peak. The type-specific curves depict the actual number of detections; the black curve depicts specimens with any HCoV detections normalized to a peak of 1,000. HCoVs, human coronaviruses.
1Preliminary results from this study were presented at the IDWeek Virtual Conference 2021,
September 29–October 3, 2021.