Volume 28, Number 10—October 2022
Synopsis
Seasonality of Common Human Coronaviruses, United States, 2014–20211
Figure 3
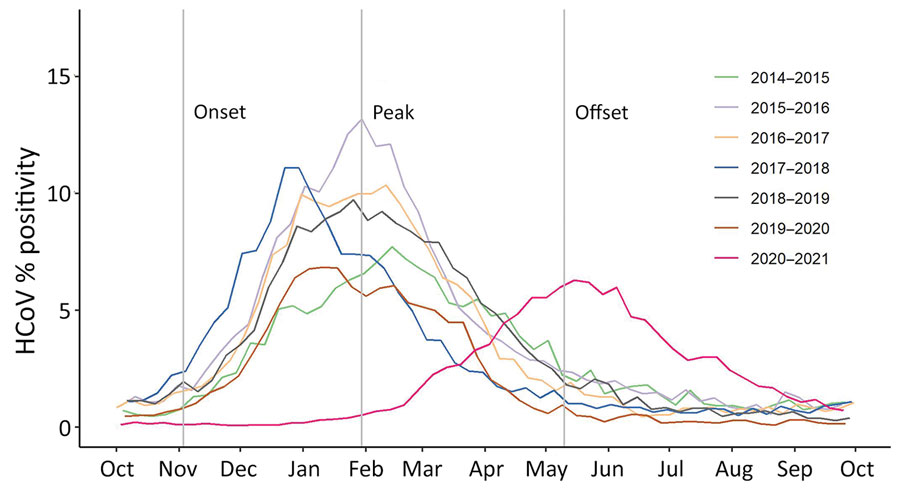
Figure 3. Percentage positivity and seasonal characteristics of common HCoVs, by season, from weekly aggregated data submitted to the National Respiratory and Enteric Virus Surveillance System, United States, October 2014–September 2021. Gray vertical lines indicate the mean starting week dates for season onset, peak, and offset for all seasons except 2020–21, based on the retrospective slope 10 method, which uses a centered 5-week moving average of weekly detections with normalization to peak to define seasonal inflections. The average onset week for the 6 seasons spanning 2014–2020 is MMWR week 44, average peak week is MMWR week 4, and the average offset week is MMWR week 19. For the 2020–21 season, the onset week is January 23 (MMWR week 3) and the peak week is May 22 (MMWR week 20) (not shown). HCoVs, human coronaviruses.
1Preliminary results from this study were presented at the IDWeek Virtual Conference 2021,
September 29–October 3, 2021.