Volume 28, Number 10—October 2022
Research
SARS-CoV-2 Vaccine Breakthrough by Omicron and Delta Variants, New York, USA
Abstract
Recently emerged SARS-CoV-2 variants have greater potential than earlier variants to cause vaccine breakthrough infections. During emergence of the Delta and Omicron variants, a matched case–control analysis used a viral genomic sequence dataset linked with demographic and vaccination information from New York, USA, to examine associations between virus lineage and patient vaccination status, patient age, vaccine type, and time since vaccination. Case-patients were persons infected with the emerging virus lineage, and controls were persons infected with any other virus lineage. Infections in fully vaccinated and boosted persons were significantly associated with the Omicron lineage. Odds of infection with Omicron relative to Delta generally decreased with increasing patient age. A similar pattern was observed with vaccination status during Delta emergence but was not significant. Vaccines offered less protection against Omicron, thereby increasing the number of potential hosts for emerging variants.
As of August 10, 2022, the SARS-CoV-2 pandemic had claimed >6.4 million human lives globally, >1 million in the United States, and >70,000 in New York state (1). Virus evolution and adaptation have been observed in persistently infected immunocompromised persons (2) and animal reservoirs (3,4), leading to the potential for new, highly adapted variants.
Novel variants of SARS-CoV-2 have shown increased rates of transmission and immune evasion (5,6). In particular, Omicron has evolved a suite of unique mutations, which have greatly increased its infectiousness (7), increased its ability to evade current vaccines (5,6), and decreased the effectiveness of convalescent plasma transfusions and monoclonal antibody treatments (8,9). To a lesser degree, the Delta variant showed some of these same patterns of increased infectiousness (10) and potential for immune evasion compared with earlier strains that preceded Delta (11).
Prior literature has also shown differences in vaccine effectiveness for SARS-CoV-2 lineages associated with variation in vaccine type, time since vaccination, and patient age. Before emergence of the Delta and Omicron variants, data showed reduced neutralizing antibody protection for the Janssen vaccine (Johnson & Johnson, https://www.jnj.com) compared with the Pfizer (Pfizer-BioNTech, https://www.pfizer.com) and Moderna (https://www.modernatx.com) vaccines (12) and slightly stronger protection for Moderna compared with Pfizer vaccines (12). An effect of time since vaccination has been demonstrated for the Delta variant (11). Younger persons were found to be more likely to be infected with Omicron (13,14).
To test the associations between vaccination status, vaccine type, and time since vaccination with lineage identity during the emergence of new variants of SARS-CoV-2, we conducted a matched case–control study. We performed analyses for the emergence of the Omicron and Delta variants in New York, USA. The study was waived by the New York State Department of Health (NYSDOH) Institutional Review Board for Human Subjects Research review.
Data Analysis
Omicron Emergence Analysis
Figure 1
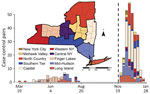
Figure 1. Matched case–control pairs used in the conditional logistic regression by analysis for the SARS-CoV-2 Delta variant (March 19, 2021–August 15, 2021) and the Omicron variant (November 28, 2021–January 24, 2022)...
We analyzed emergence of the SARS-CoV-2 Omicron variant from November 28, 2021, through January 24, 2022 (Figure 1). We matched persons infected with Omicron (case-patients) to persons infected with any other virus lineage (controls). Case-patients (n = 1,439) included infection with B.1.1.529 and all BA sublineages (at the time of the analysis, none were classified as BA.2 through BA.5). Controls (n = 728) were persons infected with all other SARS-CoV-2 lineages circulating during the period of Omicron emergence (all sequenced control samples in the matched dataset were Delta variant, B.1.617.2 or AY sublineages). We defined the start of the Omicron emergence period as the first detection in the genomic surveillance dataset (although Omicron was present in the state before that date). The emergence period ended when the last non-Omicron case was detected in the surveillance dataset. One additional case of infection with Delta was identified >14 days after the last date in the surveillance dataset but was excluded because the sensitivity analysis indicated that it would not substantively change the analysis results. We matched case-patients to controls on the basis of specimen collection date (± 6 days), location (using New York state economic regions [Figure 1]), patient age, and patient sex. We matched age according to age groups: 0–4, 5–11, 12–17, 18–29, 30–49, 50–69, 70–89, and >90 years. If an exact match could not be found, we allowed mismatches for sex. We used 1-to-1 matching, without replacement (i.e., each case-patient was matched to a unique control). We performed matching in 2 stages. In the first stage, we considered all possible matches for each case-patient. To maximize the sample size, we then sorted case-patients such that the case-patients with the fewest possible matches would be matched to controls first. To estimate odds ratios (ORs) and 95% CIs, we performed 3 sets of conditional logistic regressions.
In analysis 1, we included vaccinated and unvaccinated persons. Key variables tested were vaccination status (binary: yes/no), booster status (yes/no), vaccine type (none, Pfizer, Moderna, Janssen), time since last vaccination or booster (3 factor levels: unvaccinated, vaccinated <90 days, vaccinated >90 days). We explored time since completion of initial vaccination and time since booster but found these factors were less predictive and overlapped strongly with the combined time since last vaccination or booster variable and therefore excluded them.
In analysis 2, we examined the association between patient age and virus lineage and therefore removed age as a matching criterion. We performed a conditional logistic regression using age, other main variables for context, and interactions. For this analysis, we did not perform sorting before matching. We examined age in 2 ways: with each age group treated as a factor and with each age group treated as a continuous predictor. Model exploration revealed that a mixture of categorical and continuous predictors best described the underlying data structure (Appendix Table 1).
In analysis 3, we again matched case-patients to controls on the basis of age, but we excluded unvaccinated persons to allow time since last dose (vaccination series or booster) to be treated as continuous variables. Unvaccinated persons could not be included in this analysis because assigning them NA (not applicable) would cause these values to be excluded, and 0 would be an unrealistic value.
We tested leverage by removing each case–control pair sequentially, refitting the model and noting the change in the OR. We selected models by using Akaike information criterion (AIC) scores (15,16). Models with lower AIC scores have more model support, and models with ΔAIC >2 are generally considered less likely models. Because a more complicated nested model can be within ΔAIC of 2, nested models were required to be within 2 × no. model parameters to be considered tied (17). Of note, AIC provides a relative ranking of models but provides no information on the absolute fit of the model. We examined the fit of each model by considering its statistical significance and the OR estimates. When test results were not significant, we examined the magnitude of the OR. More research was deemed necessary if the estimated OR was large enough to be a public health concern but 95% CIs included 1.
We performed all analyses in R 4.1.2 (18) by using the package survival for conditional logistic regressions code (https://www.github.com/akeyel/CLR) (19,20). We created the New York state map in ArcGIS 10.6 (ESRI, https://www.esri.com) by using a 2017 Tiger Shapefile from the US Census Bureau (21) and Admin 1 States, provinces 50-m cultural vector shapefile from Natural Earth Data (as of March 18, 2022) (https://www.naturalearthdata.com/downloads/50m-cultural-vectors).
Delta Emergence Analysis
We analyzed emergence of the SARS-CoV-2 Delta variant during March 19, 2021–August 15, 2021 (Figure 1). The Delta analyses followed the same methods used for the Omicron analyses but with focal virus lineages (603 case-patients) including B.1.617.2 and all AY sublineages. Nonfocal virus lineages (1,816 controls) were all other lineages circulating during the period of Delta emergence (62% B.1.1.7 and Q.4 Alpha, 20% B.1.526 Iota, 3.5% P.1.X Gamma, 1% B.1.351.X Beta); none of the other non–variant of concern strains (13.7% combined) exceeded 5%. We excluded booster-associated variables because booster doses were not available (Appendix Figure 3). We omitted the vaccinated-only analysis because of low statistical power (n = 12 pairs).
Power Analysis
Statistical power for conditional logistic regression is nonlinear and depends on estimated probabilities. Although we used multiple conditional logistic regression for the analyses described above, to make the power analyses easier to set up and interpret, we calculated statistical power for univariate logistic regression by using the WebPower package (22,23) as a simplifying assumption. We examined statistical power to detect an OR of 2 with a sample size of 110 for a range of probability values (0.1–0.9 for the upper probability); we adjusted lower probability to give an OR of 2. We then used the upper probability value with the highest power (0.7) to assess statistical power for ORs of 2, 3, and 4 for sample sizes of 50–350 by increments of 50.
Data Sources
Respiratory swab specimens that were positive for SARS-CoV-2 by real-time reverse transcription PCR were sent from clinical laboratories across the state for whole-genome sequencing at the NYSDOH Wadsworth Center as part of an enhanced genomic surveillance program. Samples were selected for sequencing on the basis of cycle threshold value and region of patient residence; the goal was full geographic coverage across the state. Sample selection criteria did not change over the course of the study period. We matched samples to demographics in the Communicable Disease Electronic Surveillance System and vaccination records in the New York State Immunization Information System. For persons from whom multiple samples were collected, we included only the earliest collected sample with genome available.
Vaccination status for each person was based on dates of sample collection and administration of vaccines. A person was considered unvaccinated if the sample was collected before any vaccination, vaccinated if the sample was collected >14 days after completion of vaccination (first dose of Janssen, second dose of Pfizer or Moderna vaccine), and boosted if the sample was collected any time after receiving a booster of any vaccine type. We removed from the study persons who were partially vaccinated (sample collected between initial dose and 14 days after vaccination completion, n = 261 [90 with Moderna and 171 with Pfizer vaccine]) and persons who received a greater number of vaccinations than normal. This study does not apply to persons who received a third dose as part of their vaccination series (e.g., potentially immunocompromised persons); these persons were removed from the dataset because of different vaccination history and low sample sizes (58 persons who received a third dose <135 days after their second dose were removed).
Sequencing Methods
We performed whole-genome amplicon sequencing of SARS-CoV-2 by using a modified version of the Illumina ARTIC protocol (https://artic.network/ncov-2019) with ARTIC V3 primers in the Applied Genomics Technology Core at the Wadsworth Center, as previously described (24), and amplified later samples with ARTIC V4 primers. We sequenced samples with particularly low virus titers by using AmpliSeq chemistry on the Ion Torrent S5XL sequencer, as previously described (25).
GISAID (https://www.gisaid.org) accession numbers for sequences are available from https://github.com/akeyel/CLR/blob/main/GISAID_accession_IDs.csv. In that chart, the first column shows the GISAID accession number, and the subsequent columns indicate whether the identification number was used in the respective analyses. Data are coded such that –1 indicates records that were removed before analysis, 0 indicates records that met the basic overall study criteria but were not matched for a particular analysis, and 1 indicates that the record was included in the analysis.
Omicron Emergence
Figure 2

Figure 2. Visualization of the fixed effects from the second Omicron emergence analysis on a log-odds scale (without age matching) in a study of SARS-CoV-2 vaccine breakthrough by Omicron and Delta variants,...
In analysis 1, >80% of 272 case-patient/control pairs were 18–69 years of age; most were from the Capital and Mid-Hudson regions (Table 1; Figure 1). Among controls, 8% had received a booster, and among case-patients, 22% had received a booster. Among controls, 56.6% were unvaccinated; among case-patients, 30% were unvaccinated (Table 1). Sample sizes were 177 for Pfizer, 109 for Moderna, and 22 for Janssen vaccine recipients. The variables most associated with an Omicron lineage identity were vaccination (OR 3.1, 95% CI 2.0–4.9; p<0.001) and booster status (OR 6.7, 95% CI 3.4–13.0; p <0.001) (Table 2; Figure 2).
In analysis 2 (309 pairs), when patient age was removed as a matching criterion, younger age was also predictive of an Omicron infection; log-odds of infection with Omicron generally decreased as age increased (OR 0.962, 95% CI 0.950–0.974) (Table 2). Significant patterns beyond this log-linear age effect were found for persons in 2 age groups. log-odds of infection with Omicron were lower for persons 0–4 years of age than predicted by a log-linear age effect alone (Figure 2) and higher for persons 18–29 years of age than predicted by a log-linear age term alone; risk was highest for those 18–29 years of age (Figure 2). OR estimates for vaccination status (OR 4.8, 95% CI 2.8–8.1) and booster status (OR 38.5, 95% CI 15.9–93.2) were higher than in the analysis that used age as a matching criterion (Table 2).
In analysis 3 (vaccinated-only persons, 129 pairs), the probability of infection with Omicron decreased with an increased number of days after the last vaccine dose (OR 0.996, 95% CI 0.993–0.999) (Table 2). Vaccine type was also included in the top statistical models (Appendix Table 1) and the trend toward reduced odds of Omicron infection after vaccination with the Janssen vaccine was borderline significant (OR 0.351, 95% CI 0.132–0.935, relative to Pfizer vaccine; OR 0.388, 95% CI 0.149–1.009, relative to any mRNA vaccine) (Table 2).
Delta Emergence
In analysis 1 (55 pairs), 75% were 18–69 years of age; 89% of case-patients/controls were from the Finger Lakes, Long Island, and the Mid-Hudson regions (Table 3). A total of 74.5% of controls and 61.8% of case-patients were unvaccinated (Table 3). Vaccine type, time from last vaccination, and an interaction of the 2 were not significantly associated with an increased likelihood of infection with Delta than any other virus lineage in the fully matched conditional logistic regression (Table 4). Vaccination status was the top model (OR 2.4, 95% CI 0.8–6.8; p = 0.08). Vaccine type had no significant effect (p = 0.12), but estimated ORs were 2.9 (95% CI 0.9–8.9) for Pfizer, 0.38 (95% CI 0.04–4.2) for Moderna, and 2.0 (95% CI 0.17–23.6) for Janssen.
The power analysis showed that a sample size of 110 (55 pairs) would have a 15%–45% chance of obtaining a significant result for an OR of 2 under the simulated probability distributions. A sample size of >255 would be needed to have >80% power for an OR of 2. A sample size of 110 could have <78% power to detect an OR of 3 and 93% power to detect an OR of 4. A sample size of 24 could detect an OR of 22 with 80% power but would only have 36% power to detect an OR of 4.
When case-patients and controls were no longer matched on the basis of age (66 pairs), vaccine type was the top model (Appendix Table 2), suggesting that odds of being infected with Delta rather than any other virus lineage increased by a factor of 7.3 (2.0–26.7) for those receiving the Pfizer vaccine relative to unvaccinated persons. Effects for Moderna (2.0, 95% CI 0.25–17.1) and Janssen (0.46, 95% CI 0.04–4.76) vaccines were substantial but not individually significant.
Our exploration of vaccine breakthrough, vaccination status, and time since vaccination in this matched case–control study adds to the body of evidence supporting immune escape of SARS-CoV-2. Some results may seem counterintuitive because of the study design. For example, although a booster increases protection against infection with Omicron compared with absence of a booster (13,26), history of a booster was associated with Omicron (the emergent strain) and not Delta (the established strain) infection. This finding is consistent with evidence that suggests that having a booster is less effective for preventing infection with Omicron than with Delta (6,13). Similarly, vaccine effectiveness has been shown to wane with time (11); therefore, we hypothesized that increased time after vaccination would decrease the odds of being infected with the emergent strain.
Our analysis of New York state genomic surveillance data yielded results that are consistent with previous research showing an increased probability of breakthrough for Omicron compared with other variants for both vaccinated and boosted persons (6,8). In a similar study in Connecticut, USA, comparing odds of infection with Omicron versus Delta (6), an OR of ≈2 (95% CI 1.5–3.7 or 1.5–2.2, depending on time after vaccination) was found for vaccinated persons and ≈3 (95% CI 1.8–4.9) for boosted persons. These estimates are lower than the estimates from our study of 3.1 (95% CI 2.0–4.9) for vaccinated persons and 6.7 (95% CI 3.4–13.0) for unvaccinated persons, but the 95% CIs overlap between the 2 studies. A strong pattern of the emergent strain shows increased ability for vaccine breakthrough compared with other strains circulating at the time. Studies of prior variants of concern have found significant vaccine breakthrough in emergent variants. For example, Kustin et al. found that vaccine breakthrough for Alpha (B.1.1.7) was more likely compared with prior strains (27). Similarly, Tartof et al. found evidence for increased rates of vaccine breakthrough by Delta (B.1.617.2), although waning vaccine immunity was also a factor in that study (11). In addition, Rosenberg et al. showed increased breakthrough during the Delta emergence period and suggested that this effect was independent of waning immunity (28).
When we restricted the analysis to vaccinated persons only, time after vaccination was a statistically significant factor; probability of Omicron infection decreased with increased time after vaccination. The time-after-vaccination variable combined persons who had recently received a booster with those who had recently completed their primary series. Adding a variable to indicate booster status did not improve the model fit (Appendix Table 1). Of note, most persons in this study were >3 months past completion of their initial vaccination series. Boosters were more recent, and therefore vaccination status and booster status probably encoded much of the same information as a time-after-last-dose variable. No time-after-vaccination effect was detected if the data were coarsely divided into persons who had and had not received boosters, suggesting that more examination of this variable may be necessary. This variable was not found among the top models in the Delta emergence analysis.
Younger persons were more likely to be infected with Omicron than with Delta during the Omicron emergence period, although the data in this study cannot be used to distinguish a physiological basis from a behavioral basis for these age effects. Kahn et al. found Delta and Omicron infection be equally distributed by age among unvaccinated persons but to shift strongly toward younger persons among vaccinated persons (14); however, Accorsi et al. found elevated rates of Omicron infection among vaccinated and unvaccinated persons (13). It is possible that the age group effects are the result of a greater degree of socialization and other behavioral risk factors among persons 18–29 years of age. In 2020, college campus re-openings were associated with increased transmission of SARS-CoV-2 (29). Because Omicron infections can break through vaccinations, college campuses may have increased the likelihood of persons in this age group being infected with SARS-CoV-2 (30). The age group effect for preschool children (0–4 years of age) may represent a reduced level of socialization for this group. This effect, although included in the top model identified by the information theoretic approach here, was not statistically significant, so it also may be an artifact of low sample sizes for this age group. Other research has found that vaccines were not equally effective among age groups (V. Dorabawila, unpub. data, https://www.medrxiv.org/content/10.1101/2022.02.25.22271454v1). Vaccine effectiveness in New York was very low for persons 5–11 years of age, who received a lower dose (10 μg) of the Pfizer vaccine than for vaccinated persons >12 years of age who received a 30-μg dose (V. Dorabawila, unpub. data, https://www.medrxiv.org/content/10.1101/2022.02.25.22271454v1). However, the log-linear age effect detected here was not driven by children <12 years of age. When children <12 years of age were removed from the analysis, the estimated OR changed from 0.962 to 0.957 (95% CI 0.944–0.971), suggesting that the magnitude of the effect is greater when young children were removed from the analysis. Larger estimates for vaccination status and booster status were also greater when children <12 years of age were removed from the analysis (vaccination status OR 5.4, 95% CI 3.1–9.7; vaccination plus booster status OR 43.0, 95% CI 17.1–108.5). Vaccination rates and booster rates changed substantially during the study periods as well (Appendix Figures 2, 3), but any resulting biases were probably controlled for by the case–control study design.
Sample sizes were generally too small to detect robust vaccine type effects. The Janssen vaccine showed borderline significantly reduced OR for infection with Omicron relative to the Pfizer vaccine in 1 statistical model (Table 2; Appendix Table 1). This result would be consistent with improved performance against Omicron infection or with worse performance of this vaccine against Delta infection, as has been observed (28). Otherwise, OR estimates showed the potential for substantial differences, but overlapping 95% CIs prevent drawing robust conclusions (Table 2; Appendix Table 1).
Statistical power was constrained by the limited emergence periods and the relatively small percentage of viruses from COVID-19 case-patients that were sequenced. For Delta, the emergence period occurred during a time of reduced sequencing, because of low overall incidence during the summer of 2021, when Delta displaced previous strains (Figure 1). For Omicron, a larger sequencing effort was made, but the emergence period was considerably shorter because of the rapid dominance of the Omicron variant (Figure 1). Sample sizes could potentially be increased by expanding the regional scope of the study or incorporating sequencing results from other research laboratories.
We used only 1 matched set for each analysis. However, because case-patients were randomly matched to controls, other matches were possible. This limitation could be overcome by assessing significance with Monte Carlo simulation over the range of possible matches. That said, visual examination of leverage plots based on removing a single pair suggested that the results were generally unlikely to change with the removal of any single data point. The exception is the Delta analysis, in which a change of 1–2 data points would change the overall statistical significance of the results (Appendix Figure 1) without much change in the estimated OR.
In conclusion, this analysis of the emergence of the Omicron and Delta variants in New York, USA, based on sequenced virus identity broadly supports the results of prior studies (5–8). Vaccines offered less protection against Omicron infection, thereby increasing the number of potential hosts for emerging variants.
Dr. Keyel is a research scientist at the NYSDOH Wadsworth Center. His expertise is in Geographic Information Systems, scripting in R and Python, and ecological modeling.
Acknowledgment
This article was preprinted at https://www.medrxiv.org/content/10.1101/2022.06.24.22276709v1.
References
- Johns Hopkins University of Medicine. Johns Hopkins Coronavirus Resource Center [cited 2022 Aug 10]. https://coronavirus.jhu.edu
- Borges V, Isidro J, Cunha M, Cochicho D, Martins L, Banha L, et al. Long-term evolution of SARS-CoV-2 in an immunocompromised patient with non-Hodgkin lymphoma. MSphere. 2021;6:
e0024421 . DOIPubMedGoogle Scholar - Hale VL, Dennis PM, McBride DS, Nolting JM, Madden C, Huey D, et al. SARS-CoV-2 infection in free-ranging white-tailed deer. Nature. 2022;602:481–6. DOIPubMedGoogle Scholar
- Bashor L, Gagne RB, Bosco-Lauth AM, Bowen RA, Stenglein M, VandeWoude S. SARS-CoV-2 evolution in animals suggests mechanisms for rapid variant selection. Proc Natl Acad Sci U S A. 2021;118:
e2105253118 . DOIPubMedGoogle Scholar - Collie S, Champion J, Moultrie H, Bekker LG, Gray G. Effectiveness of BNT162b2 vaccine against Omicron variant in South Africa. N Engl J Med. 2022;386:494–6. DOIPubMedGoogle Scholar
- Chaguza C, Coppi A, Earnest R, Ferguson D, Kerantzas N, Warner F, et al. Rapid emergence of SARS-CoV-2 Omicron variant is associated with an infection advantage over Delta in vaccinated persons. Med (N Y). 2022;3:325–334.e4. DOIPubMedGoogle Scholar
- Chen J, Wang R, Gilby NB, Wei GW. Omicron variant (B.1.1.529): infectivity, vaccine breakthrough, and antibody resistance. J Chem Inf Model. 2022;62:412–22. DOIPubMedGoogle Scholar
- Liu L, Iketani S, Guo Y, Chan JFW, Wang M, Liu L, et al. Striking antibody evasion manifested by the Omicron variant of SARS-CoV-2. Nature. 2022;602:676–81. DOIPubMedGoogle Scholar
- Hoffmann M, Krüger N, Schulz S, Cossmann A, Rocha C, Kempf A, et al. The Omicron variant is highly resistant against antibody-mediated neutralization: Implications for control of the COVID-19 pandemic. Cell. 2022;185:447–456.e11. DOIPubMedGoogle Scholar
- Li B, Deng A, Li K, Hu Y, Li Z, Shi Y, et al. Viral infection and transmission in a large, well-traced outbreak caused by the SARS-CoV-2 Delta variant. Nat Commun. 2022;13:460. DOIPubMedGoogle Scholar
- Tartof SY, Slezak JM, Fischer H, Hong V, Ackerson BK, Ranasinghe ON, et al. Effectiveness of mRNA BNT162b2 COVID-19 vaccine up to 6 months in a large integrated health system in the USA: a retrospective cohort study. Lancet. 2021;398:1407–16. DOIPubMedGoogle Scholar
- Atmar RL, Lyke KE, Deming ME, Jackson LA, Branche AR, El Sahly HM, et al.; DMID 21-0012 Study Group. Homologous and heterologous Covid-19 booster vaccinations. N Engl J Med. 2022;386:1046–57. DOIPubMedGoogle Scholar
- Accorsi EK, Britton A, Fleming-Dutra KE, Smith ZR, Shang N, Derado G, et al. Association between 3 Doses of mRNA COVID-19 vaccine and symptomatic infection caused by the SARS-CoV-2 Omicron and Delta variants. JAMA. 2022;327:639–51. DOIPubMedGoogle Scholar
- Kahn F, Bonander C, Moghaddassi M, Rasmussen M, Malmqvist U, Inghammar M, et al. Risk of severe COVID-19 from the Delta and Omicron variants in relation to vaccination status, sex, age and comorbidities - surveillance results from southern Sweden, July 2021 to January 2022. Euro Surveill. 2022;27:
2200121 . DOIPubMedGoogle Scholar - Akaike H. A new look at the statistical model identification. IEEE Trans Automat Contr. 1974;19:716–23. DOIGoogle Scholar
- Burnham KP, Anderson DR. Model Selection and Multimodel inference. New York: Springer-Verlag; 2002. p. 1–488.
- Arnold TW. Uninformative parameters and model selection using Akaike’s Information Criterion. J Wildl Manage. 2010;74:1175–8. DOIGoogle Scholar
- R Core Team. R: A language and environment for statistical computing. R Foundation for Statistical Computing. Vienna (Austria); 2021 [cited 2022 Aug 10]. https://www.R-project.org
- Therneau T. A package for survival analysis in R [cited 2022 Aug 10]. https://CRAN.R-project.org/package=survival
- Therneau TM, Grambsch PM. Modeling Survival Data: Extending the Cox Model. New York: Springer; 2000.
- US Census Bureau. TIGER/Line Shapefiles [cited 2021 Nov 23]. https://www.census.gov/geo/maps-data/data/tiger-line.html
- Zhang Z, Mai Y. WebPower: basic and advanced statistical power analysis. R package version 0.7 [cited 2022 Aug 10]. https://CRAN.R-project.org/package=WebPower
- Demidenko E. Sample size determination for logistic regression revisited. Stat Med. 2007;26:3385–97. DOIPubMedGoogle Scholar
- Alpert T, Brito AF, Lasek-Nesselquist E, Rothman J, Valesano AL, MacKay MJ, et al. Early introductions and transmission of SARS-CoV-2 variant B.1.1.7 in the United States. Cell. 2021;184:2595–2604.e13. DOIPubMedGoogle Scholar
- Plitnick J, Griesemer S, Lasek-Nesselquist E, Singh N, Lamson DM, St George K. Whole-genome sequencing of SARS-CoV-2: assessment of the Ion Torrent AmpliSeq panel and comparison with the Illumina MiSeq ARTIC protocol. J Clin Microbiol. 2021;59:
e0064921 . DOIPubMedGoogle Scholar - Nyberg T, Ferguson NM, Nash SG, Webster HH, Flaxman S, Andrews N, et al.; COVID-19 Genomics UK (COG-UK) consortium. Comparative analysis of the risks of hospitalisation and death associated with SARS-CoV-2 omicron (B.1.1.529) and delta (B.1.617.2) variants in England: a cohort study. Lancet. 2022;399:1303–12. DOIPubMedGoogle Scholar
- Kustin T, Harel N, Finkel U, Perchik S, Harari S, Tahor M, et al. Evidence for increased breakthrough rates of SARS-CoV-2 variants of concern in BNT162b2-mRNA-vaccinated individuals. Nat Med. 2021;27:1379–84. DOIPubMedGoogle Scholar
- Rosenberg ES, Dorabawila V, Easton D, Bauer UE, Kumar J, Hoen R, et al. Covid-19 vaccine effectiveness in New York State. N Engl J Med. 2022;386:116–27. DOIPubMedGoogle Scholar
- Yamey G, Walensky RP. Covid-19: re-opening universities is high risk. BMJ. 2020;370:m3365. DOIPubMedGoogle Scholar
- Meredith GR, Diel DG, Frazier PI, Henderson SG, Koretzky GA, Wan J, et al. Routine surveillance and vaccination on a university campus during the spread of the SARS-CoV-2 Omicron variant. JAMA Netw Open. 2022;5:
e2212906 . DOIPubMedGoogle Scholar
Figures
Tables
Cite This ArticleOriginal Publication Date: September 01, 2022
Table of Contents – Volume 28, Number 10—October 2022
| EID Search Options |
|---|
|
|
|
|
|
|
Please use the form below to submit correspondence to the authors or contact them at the following address:
Alexander C. Keyel, New York State Department of Health, Division of Infectious Diseases, David Axelrod Institute, 120 New Scotland Rd, Albany, NY 12208, USA
Top