Volume 28, Number 11—November 2022
Research
Spatiotemporal Patterns of Anthrax, Vietnam, 1990–2015
Morgan A. Walker1, Luong Minh Tan1, Le Hai Dang, Pham Van Khang, Hoang Thi Thu Ha, Tran Thi Mai Hung, Ho Hoang Dung, Dang Duc Anh, Tran Nhu Duong, Ted Hadfield, Pham Quang Thai, and Jason K. Blackburn1
Figure 3
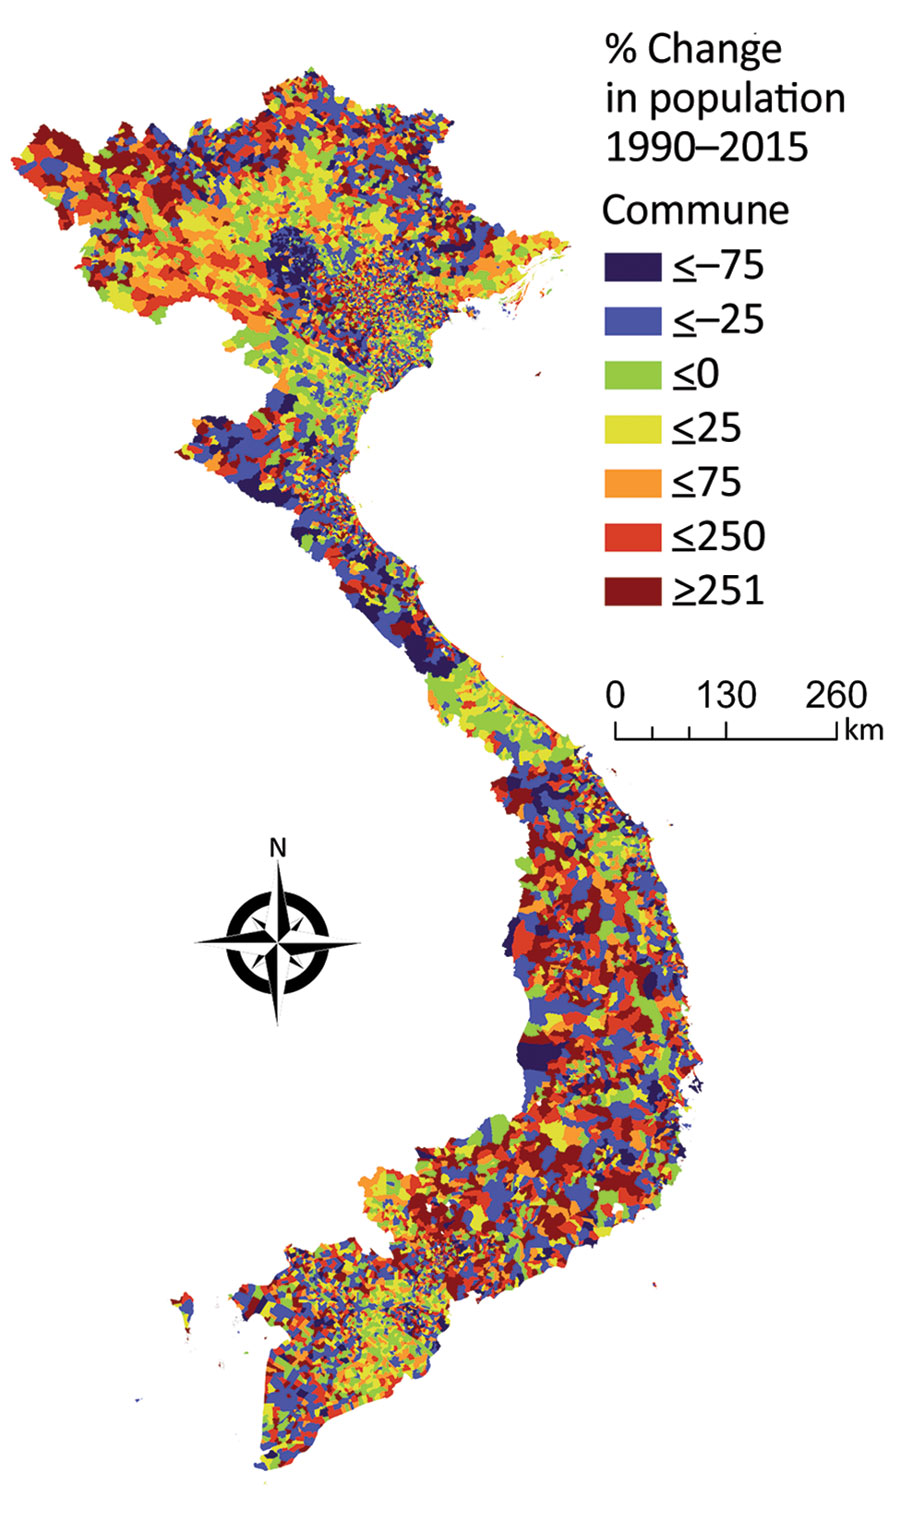
Figure 3. Percentage population change in the communes of Vietnam during 1990‒2015. Light blue, dark blue, and green values indicate communes that had population decreases, and yellow, orange, and red values indicate communes that had population growth.
1These authors contributed equally to this article.
Page created: September 01, 2022
Page updated: October 21, 2022
Page reviewed: October 21, 2022
The conclusions, findings, and opinions expressed by authors contributing to this journal do not necessarily reflect the official position of the U.S. Department of Health and Human Services, the Public Health Service, the Centers for Disease Control and Prevention, or the authors' affiliated institutions. Use of trade names is for identification only and does not imply endorsement by any of the groups named above.