Skip directly to site content Skip directly to page options Skip directly to A-Z link Skip directly to A-Z link Skip directly to A-Z link
Volume 28, Number 2—February 2022
Dispatch

Serial Interval and Transmission Dynamics during SARS-CoV-2 Delta Variant Predominance, South Korea

Sukhyun Ryu1Comments to Author , Dasom Kim1, Jun-Sik Lim1, Sheikh Taslim Ali, and Benjamin J. Cowling
Author affiliations: Konyang University College of Medicine, Daejeon, South Korea (S. Ryu, D. Kim, J.-S. Lim); Seoul National University, Seoul, South Korea (J.-S. Lim); The University of Hong Kong, Hong Kong, China (S.T. Ali, B.J. Cowling); The Laboratory of Data Discovery for Health, Hong Kong Science and Technology Park, Hong Kong (S.T. Ali, B.J. Cowling)

Main Article

Figure 1

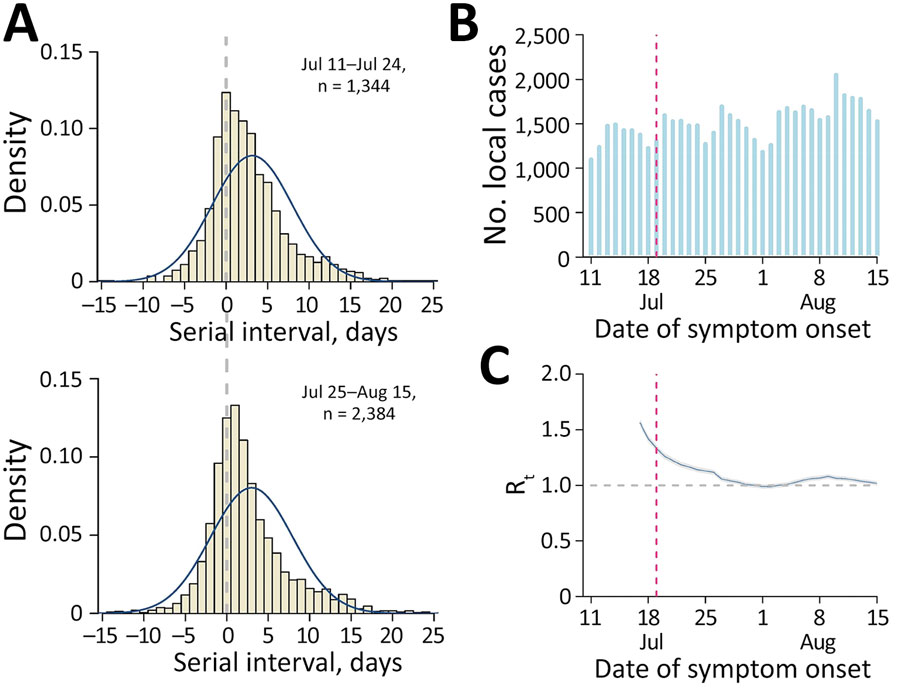
Estimated serial interval distribution, incidence of coronavirus disease, and transmissibility during predominance of the Delta variant of severe acute respiratory syndrome coronavirus 2 in South Korea. A) Estimated serial interval distribution for 3,728 infector-infectee pairs. Solid blue line indicates fitted normal distribution; vertical bars indicate the distribution of empirical serial intervals. B) Reported number of confirmed coronavirus disease cases by date of symptom onset. Red vertical dashed line indicates the date of implementation of an enhanced social distancing, including limiting gathering sizes to 4 persons nationwide on July 19, 2021. C) Estimated daily Rt of severe acute respiratory syndrome coronavirus 2 (blue line) with 95% credible intervals (gray shade). Gray horizontal dashed line indicates the critical threshold of Rt = 1. Red vertical dashed line indicates the date of implementation of an enhanced social distancing. Rt, effective reproductive number.

Figure 1. Estimated serial interval distribution, incidence of coronavirus disease, and transmissibility during predominance of the Delta variant of severe acute respiratory syndrome coronavirus 2 in South Korea. A) Estimated serial interval distribution for 3,728 infector-infectee pairs. Solid blue line indicates fitted normal distribution; vertical bars indicate the distribution of empirical serial intervals. B) Reported number of confirmed coronavirus disease cases by date of symptom onset. Red vertical dashed line indicates the date of implementation of an enhanced social distancing, including limiting gathering sizes to 4 persons nationwide on July 19, 2021. C) Estimated daily Rt of severe acute respiratory syndrome coronavirus 2 (blue line) with 95% credible intervals (gray shade). Gray horizontal dashed line indicates the critical threshold of Rt = 1. Red vertical dashed line indicates the date of implementation of an enhanced social distancing. Rt, effective reproductive number.

Main Article

1These authors contributed equally to this article.

Page created: November 29, 2021
Page updated: January 22, 2022
Page reviewed: January 22, 2022
The conclusions, findings, and opinions expressed by authors contributing to this journal do not necessarily reflect the official position of the U.S. Department of Health and Human Services, the Public Health Service, the Centers for Disease Control and Prevention, or the authors' affiliated institutions. Use of trade names is for identification only and does not imply endorsement by any of the groups named above.
file_external