Volume 28, Number 3—March 2022
Research
Infection Control Measures and Prevalence of SARS-CoV-2 IgG among 4,554 University Hospital Employees, Munich, Germany
Video 1

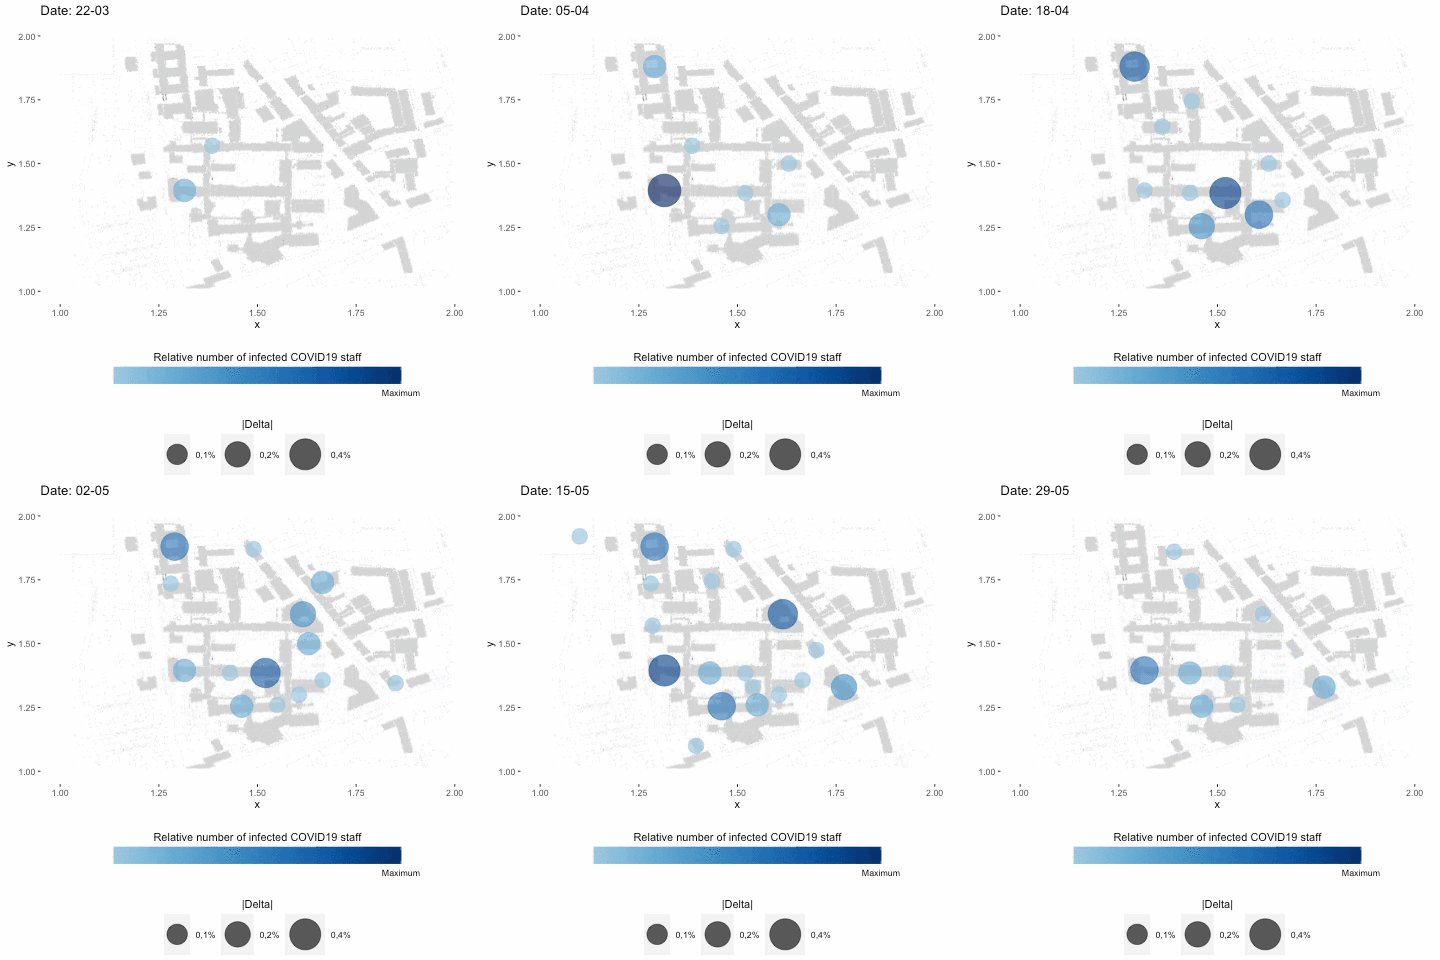
Video 1. Time lapse of relative proportions of all trajectories for coronavirus disease (COVID-19) cases. Proportions in distinct hospital locations were normalized by all timeframes during February 1‒May 29, 2020. Some patients who later tested positive for severe acute respiratory syndrome coronavirus 2 were already in the hospital before March 6, 2020, and are therefore visualized starting February 1.
1These authors contributed equally to this article.
2Members of the SeCOMRI study group are listed at the end of this article.
Page created: December 15, 2021
Page updated: February 21, 2022
Page reviewed: February 21, 2022
The conclusions, findings, and opinions expressed by authors contributing to this journal do not necessarily reflect the official position of the U.S. Department of Health and Human Services, the Public Health Service, the Centers for Disease Control and Prevention, or the authors' affiliated institutions. Use of trade names is for identification only and does not imply endorsement by any of the groups named above.