Skip directly to site content Skip directly to page options Skip directly to A-Z link Skip directly to A-Z link Skip directly to A-Z link
Volume 28, Number 3—March 2022
Research

Nowcasting (Short-Term Forecasting) of COVID-19 Hospitalizations Using Syndromic Healthcare Data, Sweden, 2020

Armin SprecoComments to Author , Anna Jöud, Olle Eriksson, Kristian Soltesz, Reidar Källström, Örjan Dahlström, Henrik Eriksson, Joakim Ekberg, Carl-Oscar Jonson, Carl-Johan Fraenkel, Torbjörn Lundh, Philip Gerlee, Fredrik Gustafsson, and Toomas Timpka
Author affiliations: Linköping University, Linköping, Sweden (A. Spreco, O. Eriksson, R. Källström, Ö. Dahlström, H. Eriksson J. Ekberg, C.-O. Jonson, F. Gustafsson, T. Timpka); Region Östergötland, Linköping (A. Spreco, R. Källström, J. Ekberg, C.-O. Jonson, T. Timpka); Lund University, Lund, Sweden (A. Jöud, K. Soltesz); Skåne University Hospital, Lund (A. Jöud. C.-J. Fraenkel); Chalmers University of Technology, Gothenburg, Sweden (T. Lundh, P. Gerlee); Gothenburg University, Gothenburg (T. Lundh, P. Gerlee)

Main Article

Figure 1

Daily incidence of telenursing calls for 2 chief complaints, COVID-19 hospitalizations, and laboratory-confirmed influenza plus reference data from before the COVID-19 pandemic, Östergötland County, Sweden. A) Telenursing calls per 100,000 population for chief complaints of cough by adult (blue line) and fever by adult (red line), February 20–June 30, 2020. B) COVID-19 hospitalizations per 100,000 population, February 20–June 30, 2020. C) Cases of laboratory-confirmed influenza per 100,000 population February 20–June 30, 2020 (black line). Light gray line indicates the average for cases of laboratory-confirmed influenza in 2015–2019; dark gray shaded area is the corresponding range. D) Telenursing calls per 100,000 population for the chief complaint cough by adult in 2015–2019 (light grey line) with corresponding range (dark grey shaded area). E) Telenursing calls per 100,000 population for the chief complaint fever by adult in 2015–2019 (light grey line) with corresponding range (dark grey shaded area).

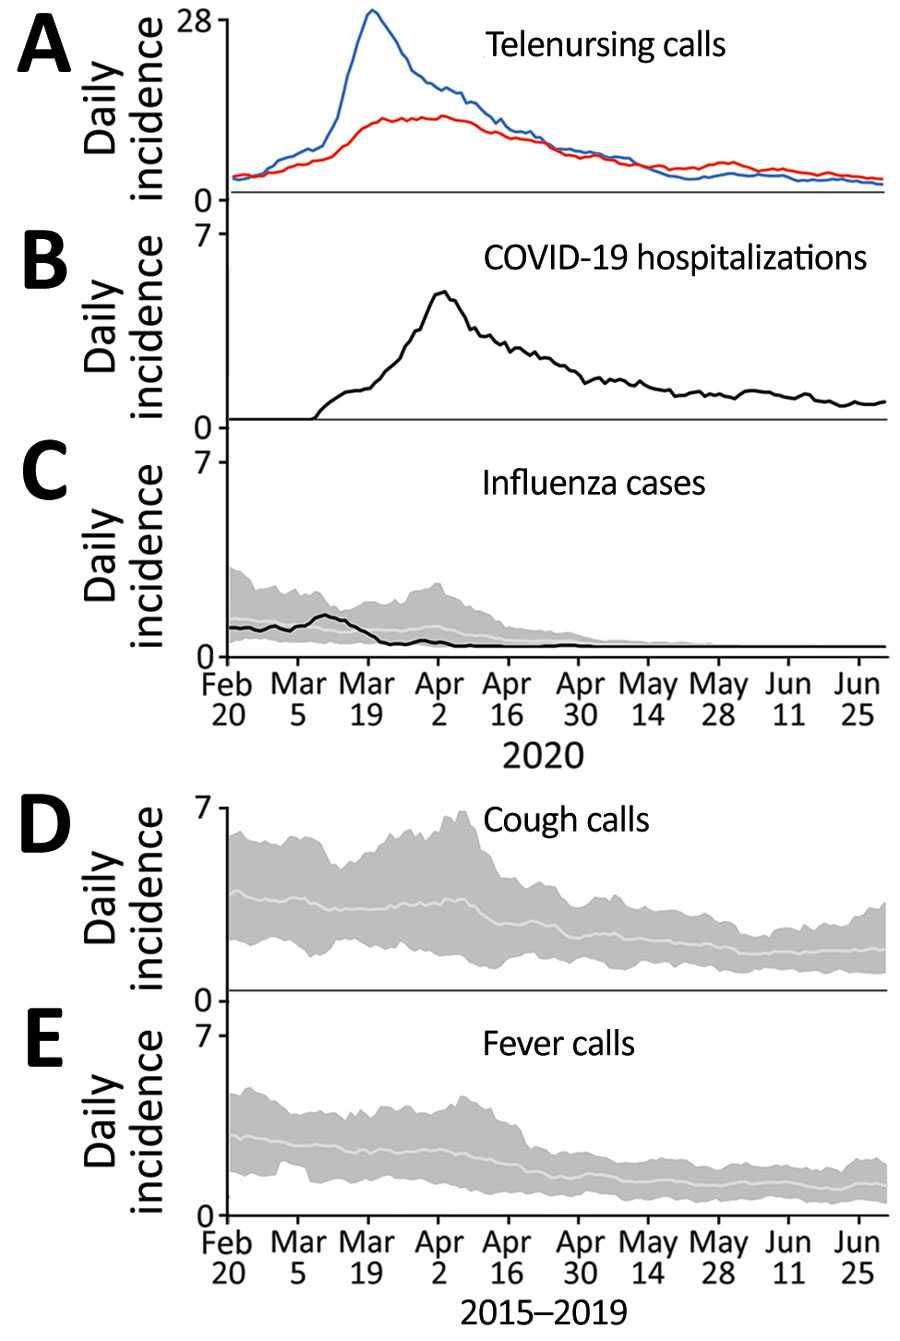
Figure 1. Daily incidence of telenursing calls for 2 chief complaints, COVID-19 hospitalizations, and laboratory-confirmed influenza plus reference data from before the COVID-19 pandemic, Östergötland County, Sweden. A) Telenursing calls per 100,000 population for chief complaints of cough by adult (blue line) and fever by adult (red line), February 20–June 30, 2020. B) COVID-19 hospitalizations per 100,000 population, February 20–June 30, 2020. C) Cases of laboratory-confirmed influenza per 100,000 population February 20–June 30, 2020 (black line). Light gray line indicates the average for cases of laboratory-confirmed influenza in 2015–2019; dark gray shaded area is the corresponding range. D) Telenursing calls per 100,000 population for the chief complaint cough by adult in 2015–2019 (light grey line) with corresponding range (dark grey shaded area). E) Telenursing calls per 100,000 population for the chief complaint fever by adult in 2015–2019 (light grey line) with corresponding range (dark grey shaded area).

Main Article

Page created: January 11, 2022
Page updated: February 21, 2022
Page reviewed: February 21, 2022
The conclusions, findings, and opinions expressed by authors contributing to this journal do not necessarily reflect the official position of the U.S. Department of Health and Human Services, the Public Health Service, the Centers for Disease Control and Prevention, or the authors' affiliated institutions. Use of trade names is for identification only and does not imply endorsement by any of the groups named above.
file_external