Skip directly to site content Skip directly to page options Skip directly to A-Z link Skip directly to A-Z link Skip directly to A-Z link
Volume 28, Number 3—March 2022
Dispatch

Encephalitozoon cuniculi and Extraintestinal Microsporidiosis in Bird Owners

Marta KiciaComments to Author , Żaneta Zajączkowska, Martin Kváč, Kamil Cebulski, Nikola Holubová, Piotr Wencel, Leszek Mayer, Maria Wesołowska, and Bohumil Sak
Author affiliations: Wroclaw Medical University, Wroclaw, Poland (M. Kicia, Z. Zajączkowska, K. Cebulski, M. Wesołowska); Biology Centre of the Czech Academy of Sciences, České Budějovice, Czech Republic (M. Kváč, N. Holubová, B. Sak); University of South Bohemia, České Budějovice (M. Kváč, N. Holubová); Al Aseefa Falcon Clinic, Dubai, United Arab Emirates (P. Wencel); Medical University of Gdansk, Gdansk, Poland (L. Mayer)

Main Article

Figure

Phylogenetic relationships of Encephalitozoon cuniculi genotype II and E. hellem genotype 1A obtained from 2 exotic bird breeders and 2 of their birds compared with other Encephalitozoon species and genotypes. Bold type indicates sequences obtained in this study, identified by isolate number (e.g., C1.615); black circles indicate isolates from humans; squares indicate isolates from birds. We analyzed a partial sequence of 16S rRNA gene, the entire internal transcribed spacer region, and a partial sequence of 5.8S rRNA gene inferred by neighbor-joining analyses and computed using the Tamura 3-parameter method. We modeled the rate variation among sites with a gamma distribution. Percentages of replicate trees in which the associated taxa clustered together in the bootstrap test (1,000 replicates) are shown next to the branches. The final dataset contained a total of 220 positions. GenBank accession numbers are in parentheses. Scale bar indicates nucleotide substitutions per site.

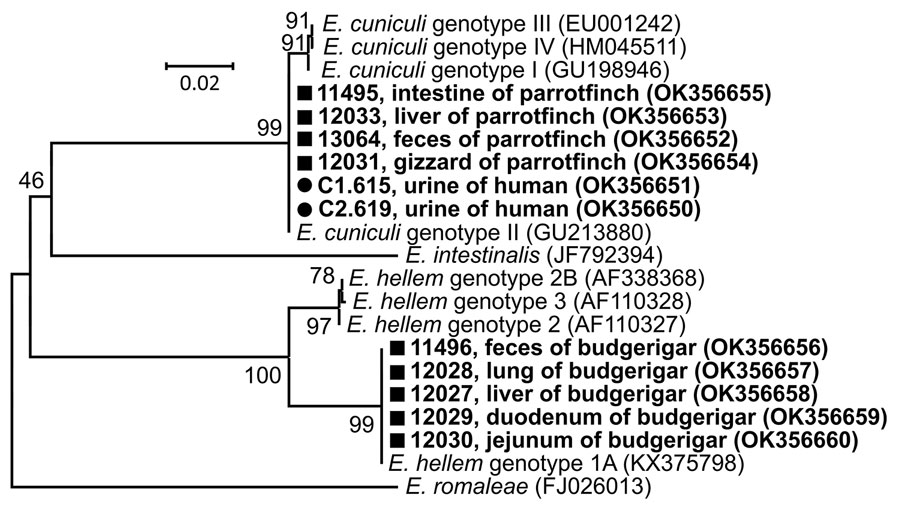
Figure. Phylogenetic relationships of Encephalitozoon cuniculi genotype II and E. hellem genotype 1A obtained from 2 exotic bird breeders and 2 of their birds compared with other Encephalitozoon species and genotypes. Bold type indicates sequences obtained in this study, identified by isolate number (e.g., C1.615); black circles indicate isolates from humans; squares indicate isolates from birds. We analyzed a partial sequence of 16S rRNA gene, the entire internal transcribed spacer region, and a partial sequence of 5.8S rRNA gene inferred by neighbor-joining analyses and computed using the Tamura 3-parameter method. We modeled the rate variation among sites with a gamma distribution. Percentages of replicate trees in which the associated taxa clustered together in the bootstrap test (1,000 replicates) are shown next to the branches. The final dataset contained a total of 220 positions. GenBank accession numbers are in parentheses. Scale bar indicates nucleotide substitutions per site.

Main Article

Page created: January 11, 2022
Page updated: February 21, 2022
Page reviewed: February 21, 2022
The conclusions, findings, and opinions expressed by authors contributing to this journal do not necessarily reflect the official position of the U.S. Department of Health and Human Services, the Public Health Service, the Centers for Disease Control and Prevention, or the authors' affiliated institutions. Use of trade names is for identification only and does not imply endorsement by any of the groups named above.
file_external