Skip directly to site content Skip directly to page options Skip directly to A-Z link Skip directly to A-Z link Skip directly to A-Z link
Volume 28, Number 4—April 2022
Research

SARS-CoV-2 IgG Seroprevalence among Blood Donors as a Monitor of the COVID-19 Epidemic, Brazil

Daniel Gonçalves Chaves1Comments to Author , Ricardo Hiroshi Caldeira Takahashi1, Felipe Campelo, Maria Clara Fernandes da Silva Malta, Isabelle Rocha de Oliveira, Edel Figueiredo Barbosa-Stancioli, Maísa Aparecida Ribeiro, and Marina Lobato Martins
Author affiliations: Fundação Hemominas, Belo Horizonte, Brazil (D.G. Chaves, M.C.F. da Silva Malta, M.A. Ribeiro, M.L. Martins); Universidade Federal de Minas Gerais, Belo Horizonte (R.H.C. Takahashi, F. Campelo, I.R. de Oliveira, E.F. Barbosa-Stancioli); Aston University, Birmingham, UK (F. Campelo)

Main Article

Figure 3

Proportion of severe acute respiratory syndrome coronavirus 2 (SARS-CoV-2) IgG–positive results among blood donors in blood donation centers in 7 cities in Minas Gerais, Brazil, March–December 2020. A) Belo Horizonte; B) Governador Valadares; C) Juiz de Fora; D) Montes Claros; E) Pouso Alegre; F) Uberaba; G) Uberlândia. Blue dots indicate proportion of SARS-CoV-2–positive donors at the end each month; vertical blue lines indicate 95% CIs. Black squares indicate the official cumulative prevalence of reported coronavirus disease cases for each city. Red lines represent model estimates of the number of infected persons, including reported and unreported cases, in each city, as a proportion of the city’s population. Vertical dashed lines indicate national holidays.

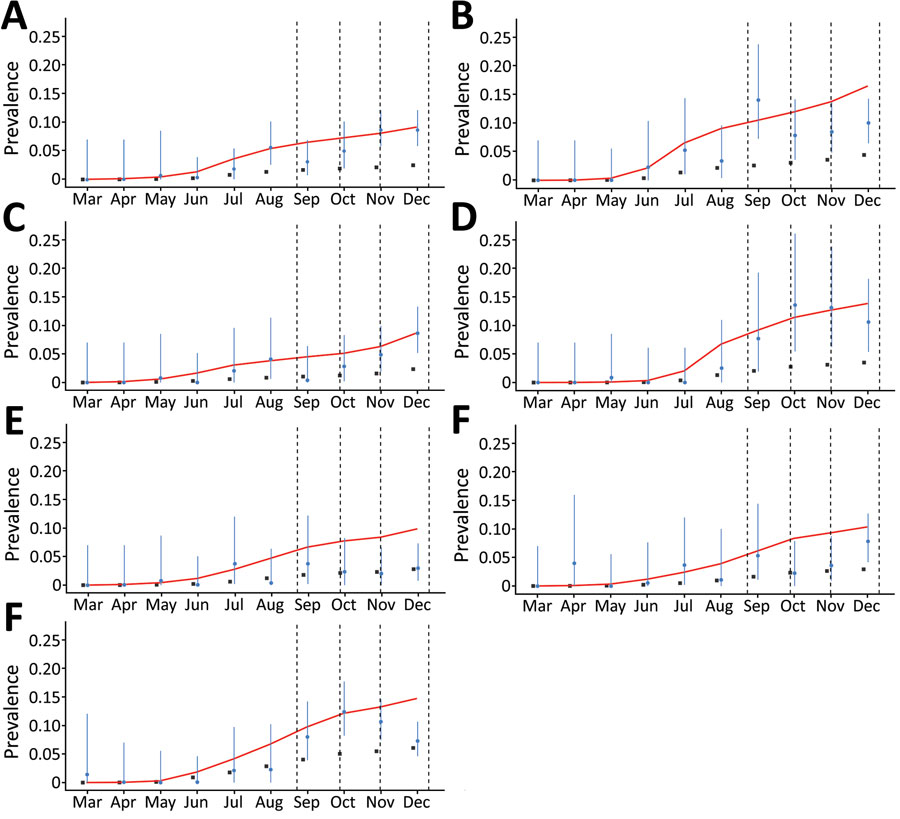
Figure 3. Proportion of severe acute respiratory syndrome coronavirus 2 (SARS-CoV-2) IgG–positive results among blood donors in blood donation centers in 7 cities in Minas Gerais, Brazil, March–December 2020. A) Belo Horizonte; B) Governador Valadares; C) Juiz de Fora; D) Montes Claros; E) Pouso Alegre; F) Uberaba; G) Uberlândia. Blue dots indicate proportion of SARS-CoV-2–positive donors at the end each month; vertical blue lines indicate 95% CIs. Black squares indicate the official cumulative prevalence of reported coronavirus disease cases for each city. Red lines represent model estimates of the number of infected persons, including reported and unreported cases, in each city, as a proportion of the city’s population. Vertical dashed lines indicate national holidays.

Main Article

1These authors contributed equally to this article.

Page created: February 09, 2022
Page updated: March 19, 2022
Page reviewed: March 19, 2022
The conclusions, findings, and opinions expressed by authors contributing to this journal do not necessarily reflect the official position of the U.S. Department of Health and Human Services, the Public Health Service, the Centers for Disease Control and Prevention, or the authors' affiliated institutions. Use of trade names is for identification only and does not imply endorsement by any of the groups named above.
file_external