Skip directly to site content Skip directly to page options Skip directly to A-Z link Skip directly to A-Z link Skip directly to A-Z link
Volume 28, Number 4—April 2022
Research

SARS-CoV-2 IgG Seroprevalence among Blood Donors as a Monitor of the COVID-19 Epidemic, Brazil

Daniel Gonçalves Chaves1Comments to Author , Ricardo Hiroshi Caldeira Takahashi1, Felipe Campelo, Maria Clara Fernandes da Silva Malta, Isabelle Rocha de Oliveira, Edel Figueiredo Barbosa-Stancioli, Maísa Aparecida Ribeiro, and Marina Lobato Martins
Author affiliations: Fundação Hemominas, Belo Horizonte, Brazil (D.G. Chaves, M.C.F. da Silva Malta, M.A. Ribeiro, M.L. Martins); Universidade Federal de Minas Gerais, Belo Horizonte (R.H.C. Takahashi, F. Campelo, I.R. de Oliveira, E.F. Barbosa-Stancioli); Aston University, Birmingham, UK (F. Campelo)

Main Article

Figure 2

Apparent lethality of coronavirus disease (COVID-19) in 6 cities (Belo Horizonte, Pouso Alegre, Montes Claros, Juiz de Fora, Governador Valadares, and Uberaba), Minas Gerais State, Brazil, April–December 2020. Gray shading and gray data line indicate the beginning of the COVID-19 epidemic in Minas Gerais, days 1–60, in which few cases were reported and the testing infrastructure was still being organized. Red data line indicates days 61–290 of the epidemic. Our model predicted the apparent lethality during days 60–120 to be nearly 5.2% and to fall during days 121–290 to nearly 3.0% (gray horizontal lines). This change corresponds to a nearly 70% increase in the value of α in our model (proportion of infected persons that are reported), assuming that the actual lethality has not changed. We did not include data from the city of Uberlândia in this estimation due to local legislation regulating COVID-19 testing, which resulted in a much larger proportion of people being tested in that municipality than in the other cities. Markings for each month represent the first day of the month.

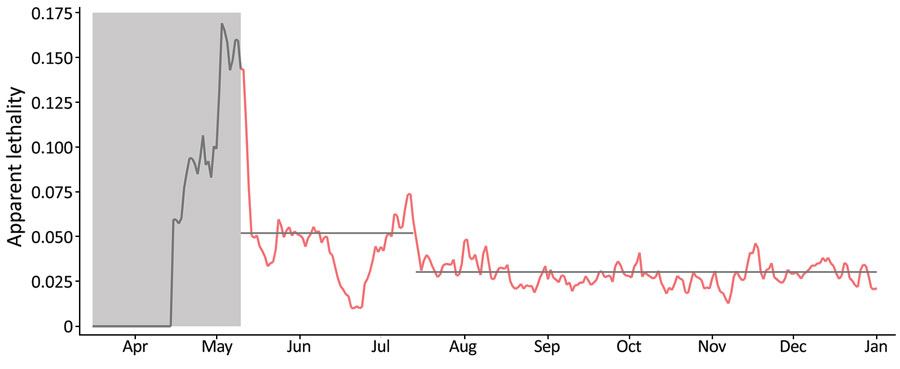
Figure 2. Apparent lethality of coronavirus disease (COVID-19) in 6 cities (Belo Horizonte, Pouso Alegre, Montes Claros, Juiz de Fora, Governador Valadares, and Uberaba), Minas Gerais State, Brazil, April–December 2020. Gray shading and gray data line indicate the beginning of the COVID-19 epidemic in Minas Gerais, days 1–60, in which few cases were reported and the testing infrastructure was still being organized. Red data line indicates days 61–290 of the epidemic. Our model predicted the apparent lethality during days 60–120 to be nearly 5.2% and to fall during days 121–290 to nearly 3.0% (gray horizontal lines). This change corresponds to a nearly 70% increase in the value of α in our model (proportion of infected persons that are reported), assuming that the actual lethality has not changed. We did not include data from the city of Uberlândia in this estimation due to local legislation regulating COVID-19 testing, which resulted in a much larger proportion of people being tested in that municipality than in the other cities. Markings for each month represent the first day of the month.

Main Article

1These authors contributed equally to this article.

Page created: February 09, 2022
Page updated: March 19, 2022
Page reviewed: March 19, 2022
The conclusions, findings, and opinions expressed by authors contributing to this journal do not necessarily reflect the official position of the U.S. Department of Health and Human Services, the Public Health Service, the Centers for Disease Control and Prevention, or the authors' affiliated institutions. Use of trade names is for identification only and does not imply endorsement by any of the groups named above.
file_external