Volume 28, Number 5—May 2022
Research
Estimating Relative Abundance of 2 SARS-CoV-2 Variants through Wastewater Surveillance at 2 Large Metropolitan Sites, United States
Figure 2
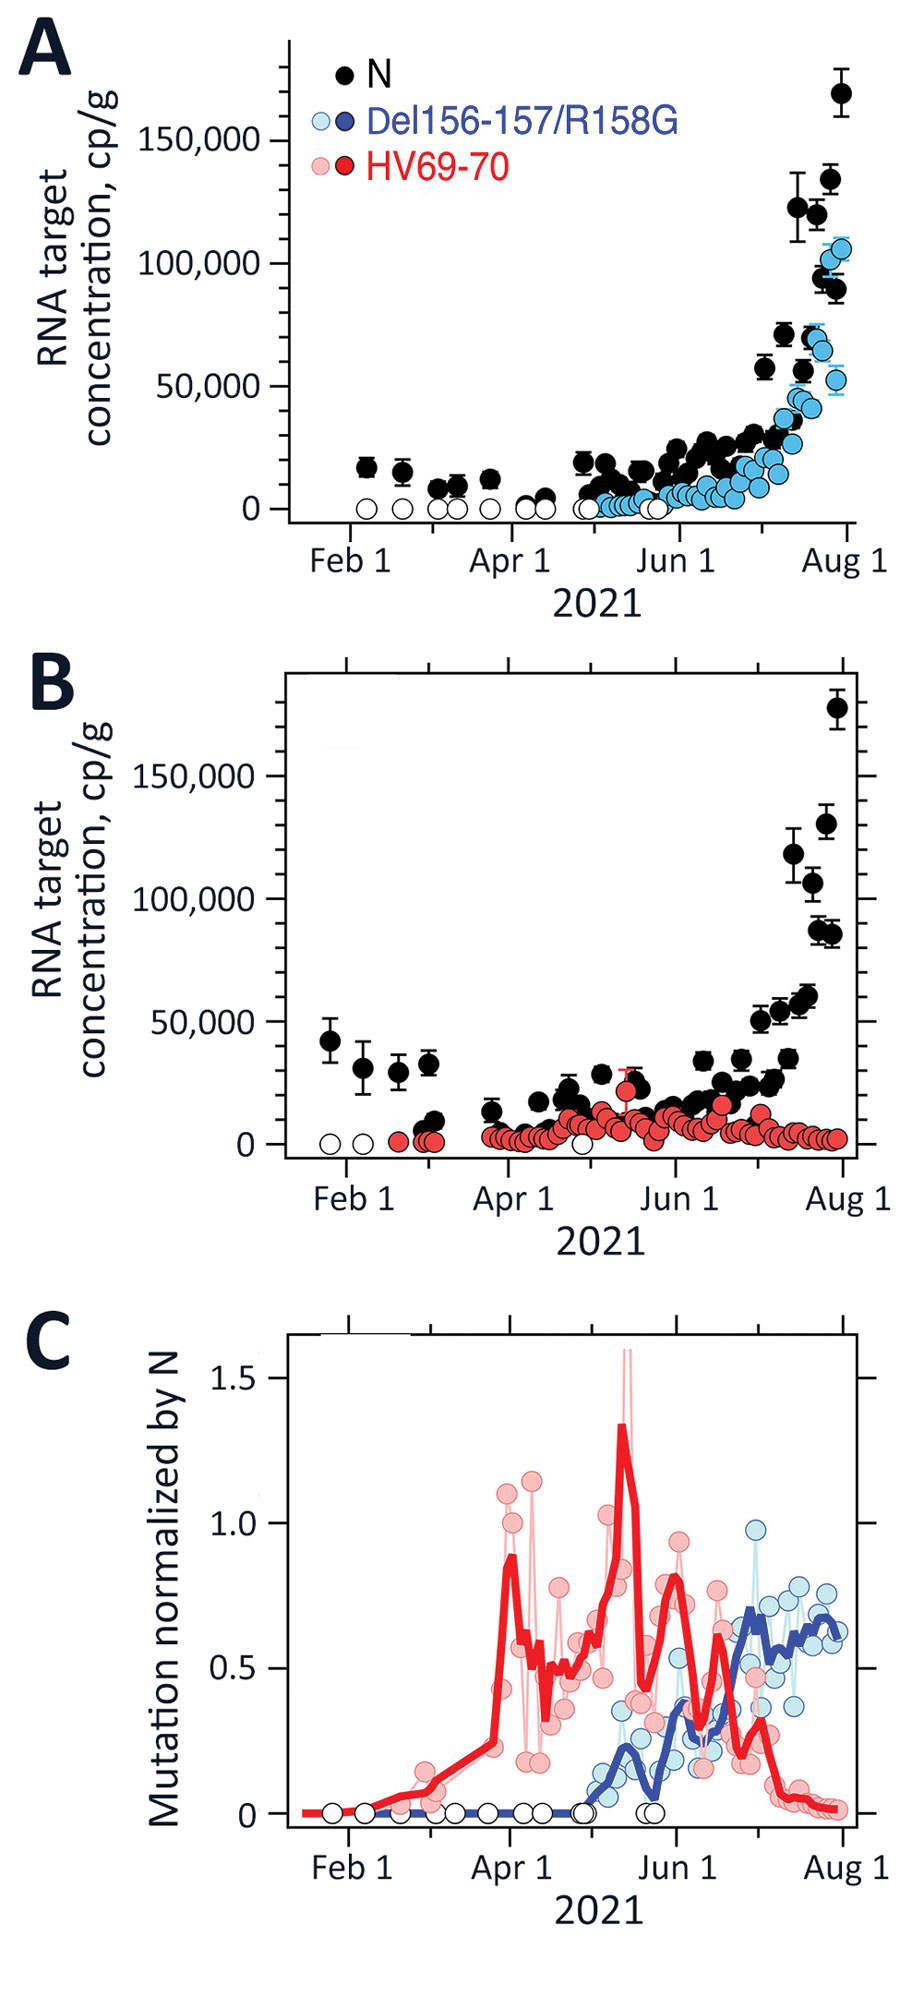
Figure 2. Measurements of severe acute respiratory syndrome coronavirus 2 variants of concern in wastewater solids, Sacramento, California, USA. Concentrations of N gene and mutations found in Delta (Del156-157/R158G; panel A), and Alpha (HV69-70; panel B) severe acute respiratory syndrome coronavirus 2 in wastewater solids and their ratio (panel C). Error bars in panels A and B represent SDs derived from the 10 replicates run for each sample; open white circles are nondetects ((below the limit of detection) and shown as 0. Errors include technical and replication errors. If error bars are not visible, then errors are smaller than the symbol. For Del156-157/R158G/N ratio, the smoothed line is a 3-point running average, and for the HV69-70/N ratio, the smoothed line is a 7-point running average; each approximates a weekly average. The timescale for the HV69-70 data (B) is truncated for visualization; additional data on dates before January 15, 2021, are described in the article and were nondetects. One data point is located beyond the upper bound of the y-axis (C): the value for HV69-70/N on May 14, 2021, was 2.4. N, nucleoprotein.
1These first authors contributed equally to this article.