Volume 28, Number 6—June 2022
Dispatch
Secondary Attack Rate, Transmission and Incubation Periods, and Serial Interval of SARS-CoV-2 Omicron Variant, Spain
Figure 1
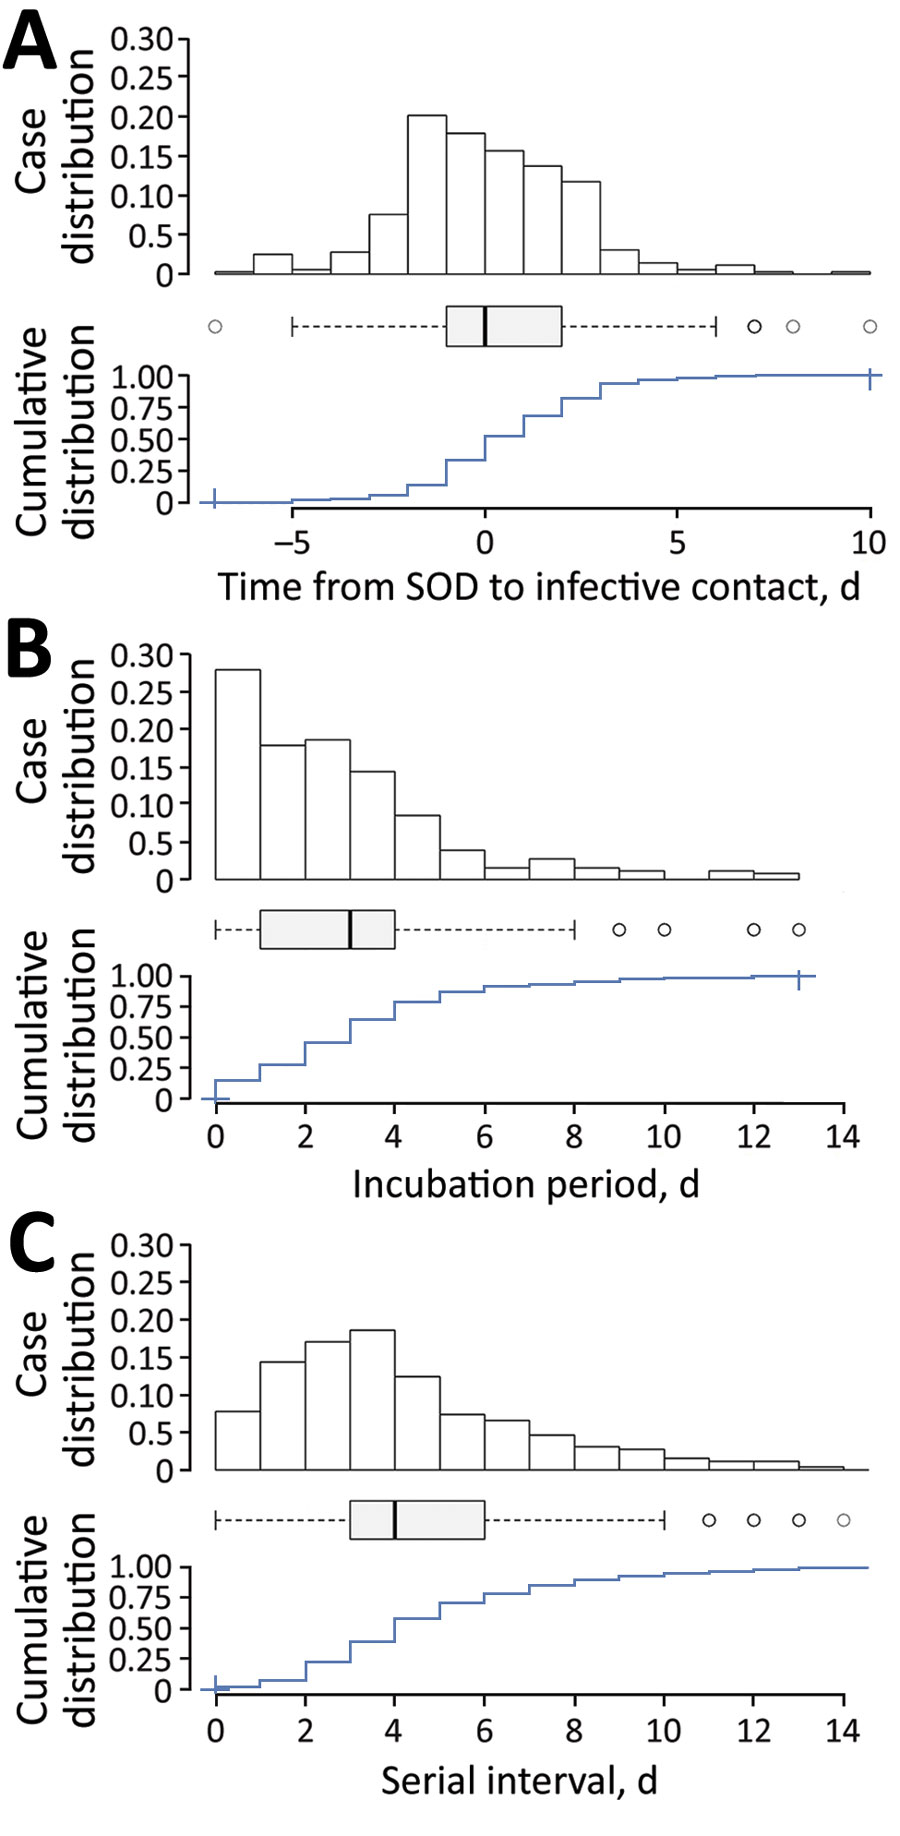
Figure 1. Distribution of Omicron variant SARS-CoV-2 cases, Cantabria, Spain, December 2021. A) Transmission period; B) incubation period; C) serial interval. Each panel shows case density over time (top), a typical boxplot (middle), and cumulative distribution for the period (bottom). For the boxplot, the center line indicates the median, the box left and right ends the interquartile range, the error bars 95% CI, and the open circles outliers. SOD, symptom onset date.
Page created: March 23, 2022
Page updated: May 22, 2022
Page reviewed: May 22, 2022
The conclusions, findings, and opinions expressed by authors contributing to this journal do not necessarily reflect the official position of the U.S. Department of Health and Human Services, the Public Health Service, the Centers for Disease Control and Prevention, or the authors' affiliated institutions. Use of trade names is for identification only and does not imply endorsement by any of the groups named above.