Volume 29, Number 1—January 2023
Research
Integrating Citizen Scientist Data into the Surveillance System for Avian Influenza Virus, Taiwan
Figure 4

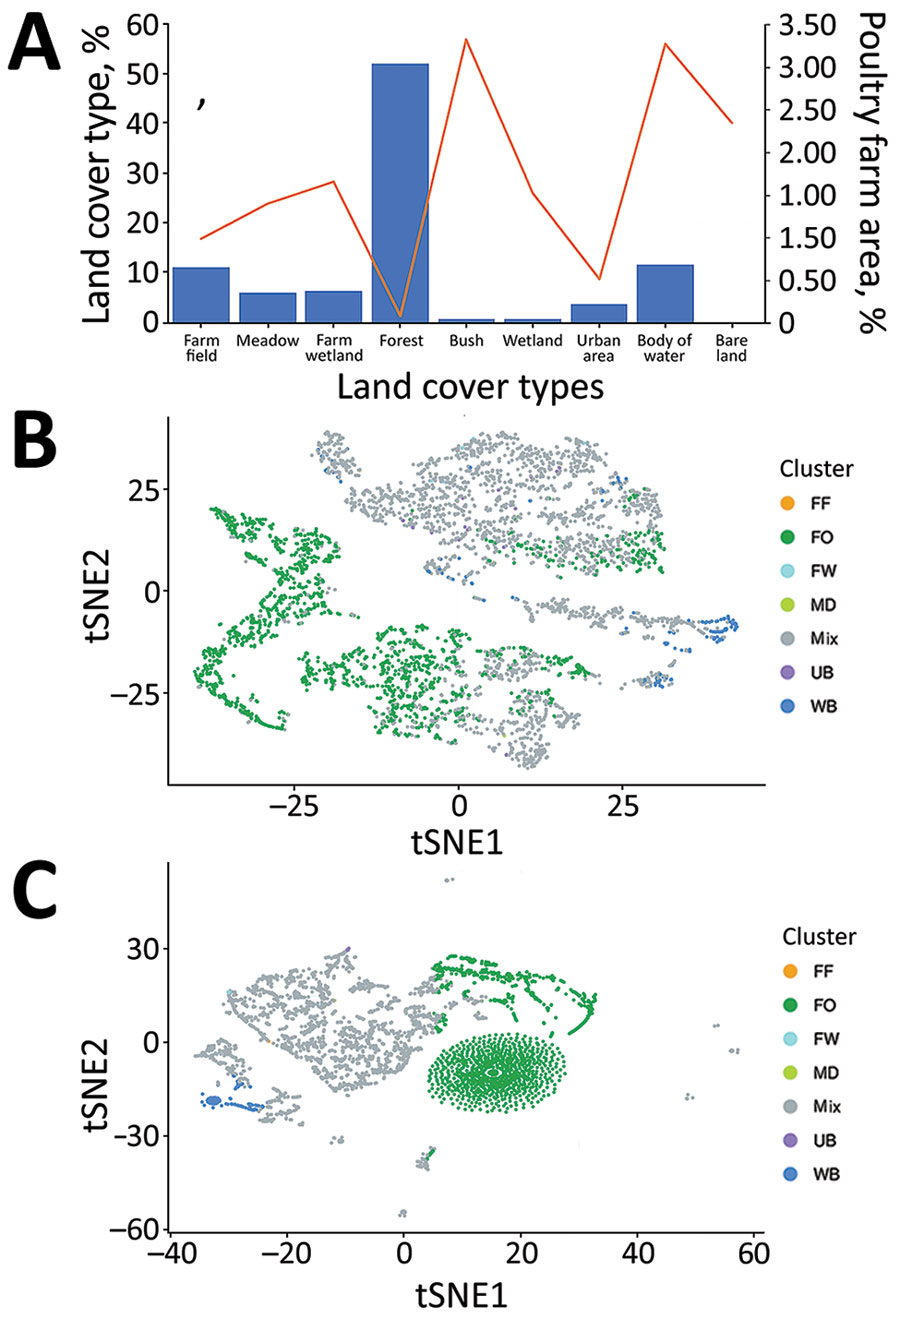
Figure 4. Land cover and bird distribution data for study of integrating citizen scientist data into the surveillance system for avian influenza virus, Taiwan. A) Percentages of 9 land-cover types in the total area of Taiwan main island (bars), area of poultry farms in the total area of indicated land-cover types (line). B, C) The clustering pattern of the area of each land-cover type (B) and the propensity score for each bird species from 3,764 grids partitioned by 3-km × 3-km squares of the main island of Taiwan (C), are based on principal component analysis and tSNE dimension reduction. Clusters are colored by the land-cover type as shown in panel A. For 4,762 grids, if 1 specific land-cover type is composed of >90% in the grid, such grid will be regarded as such specific land-cover type. Otherwise, it will be labeled as the mixed land-cover type. The labels of clusters in panels B and C are consistent with those in panel A. FF, farm field; FO, forest; FW, farm wetland; MD, meadow; mix, mixed land-cover types; tSNE, t-distributed stochastic neighbor embedding UB, urban; WB, water body.