Volume 29, Number 1—January 2023
Research
Integrating Citizen Scientist Data into the Surveillance System for Avian Influenza Virus, Taiwan
Hong-Dar Isaac Wu, Ruey-Shing Lin, Wen-Han Hwang, Mei-Liang Huang, Bo-Jia Chen, Tseng-Chang Yen, and Day-Yu Chao
Figure 5
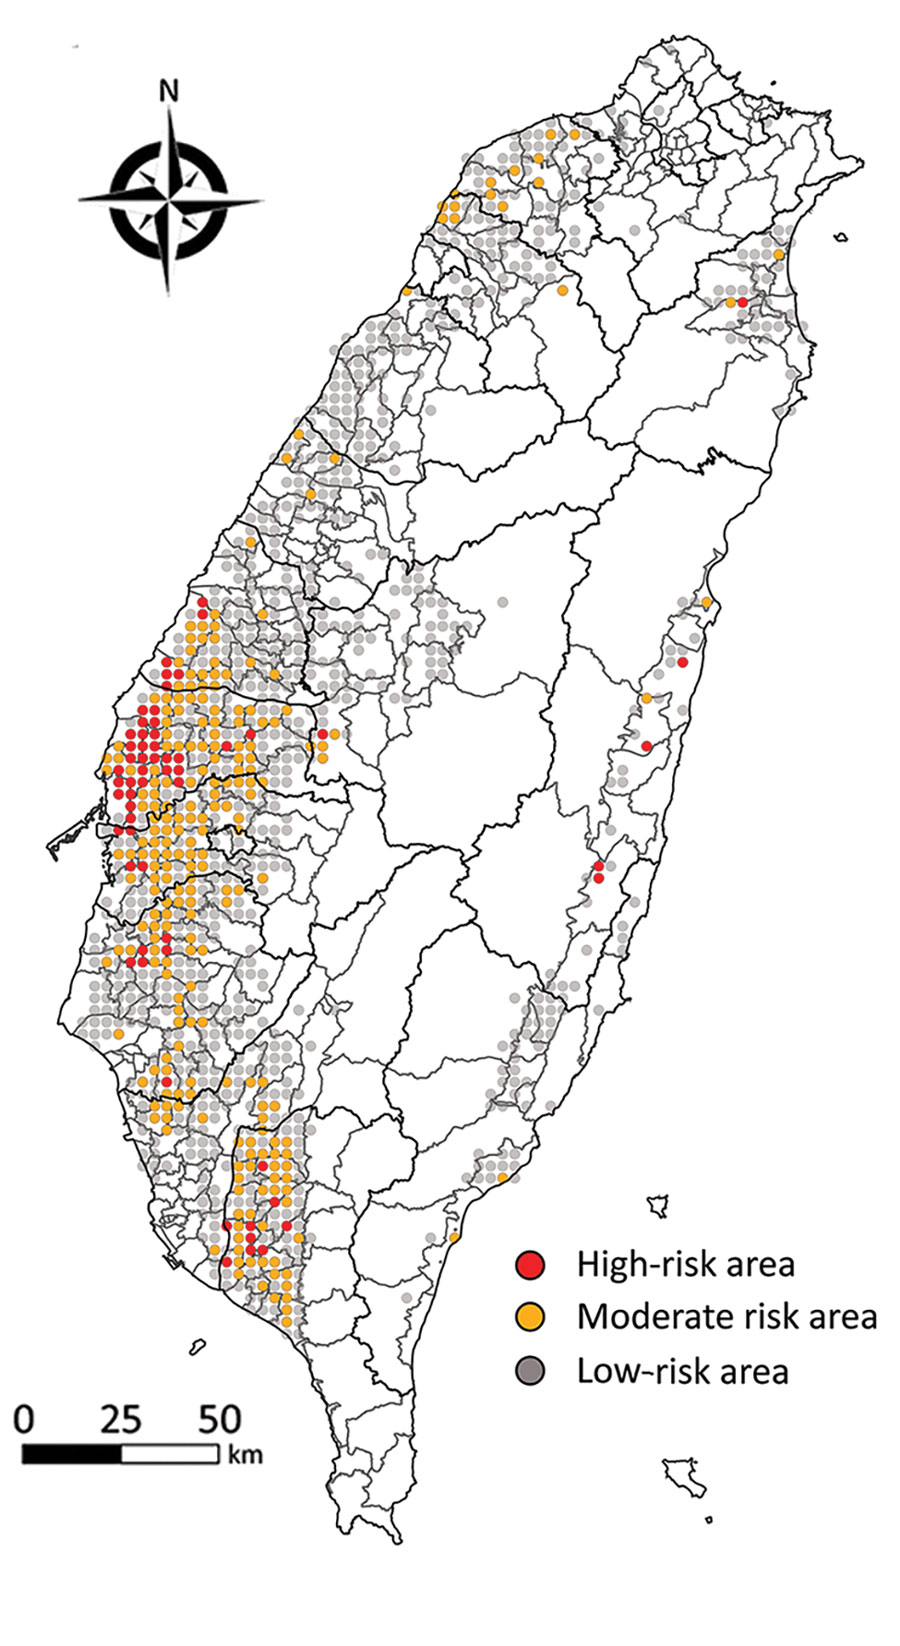
Figure 5. Risk maps showing risk of poultry farm acquiring avian influenza virus infection from migratory wild birds, from study of integrating citizen scientist data into the surveillance system for avian influenza virus, Taiwan. Each dot represents each 3-km × 3-km grid. Red dots represent the high-risk area with probability calculated based on 10 bird species with high risk of transmitting avian influenza virus into poultry farms (Table). Orange dots represent the middle-risk area, with bird species with >1 positive McNemar test result. Gray dots represent the low-risk area with bird species having no positive or negative McNemar test results.
Page created: November 30, 2022
Page updated: December 21, 2022
Page reviewed: December 21, 2022
The conclusions, findings, and opinions expressed by authors contributing to this journal do not necessarily reflect the official position of the U.S. Department of Health and Human Services, the Public Health Service, the Centers for Disease Control and Prevention, or the authors' affiliated institutions. Use of trade names is for identification only and does not imply endorsement by any of the groups named above.