Volume 29, Number 1—January 2023
Research
Risk for Severe COVID-19 Outcomes among Persons with Intellectual Disabilities, the Netherlands
Monique C.J. Koks-Leensen , Bianca W.M. Schalk, Esther J. Bakker-van Gijssel, Aura Timen, Masha E. Nägele, Milou van den Bemd, Geraline L. Leusink, Maarten Cuypers, and Jenneken Naaldenberg
Figure 1
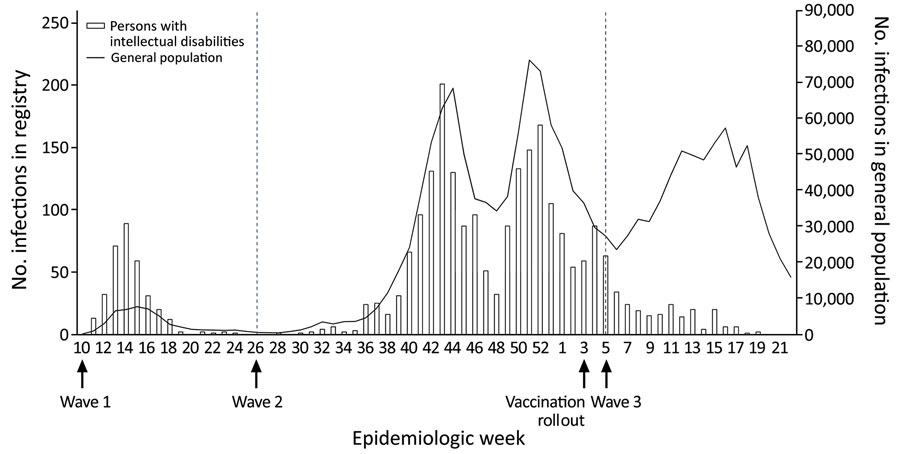
Figure 1. Weekly number of COVID-19 infections among persons with intellectual disabilities and the general population, the Netherlands, March 2020–May 2021. Graph shows epidemiologic weeks during 3 pandemic waves in the Netherlands: wave I, March–June 2020; wave II, July 2020–January 2021; and wave III, February–May 2021. The registry included 2,586 persons with intellectual disabilities in long-term care. Scales for the y-axes differ substantially to underscore patterns.
Page created: November 08, 2022
Page updated: December 21, 2022
Page reviewed: December 21, 2022
The conclusions, findings, and opinions expressed by authors contributing to this journal do not necessarily reflect the official position of the U.S. Department of Health and Human Services, the Public Health Service, the Centers for Disease Control and Prevention, or the authors' affiliated institutions. Use of trade names is for identification only and does not imply endorsement by any of the groups named above.