Volume 29, Number 10—October 2023
Research
Cycle Threshold Values as Indication of Increasing SARS-CoV-2 New Variants, England, 2020–2022
Rebecca E. Harrison , Ahmed Hamada, Nujcharee Haswell, Aigul Groves, Karina-Doris Vihta, Kerry Cella, Sarah Garner, Ann Sarah Walker, and Anna C. Seale
Figure 3
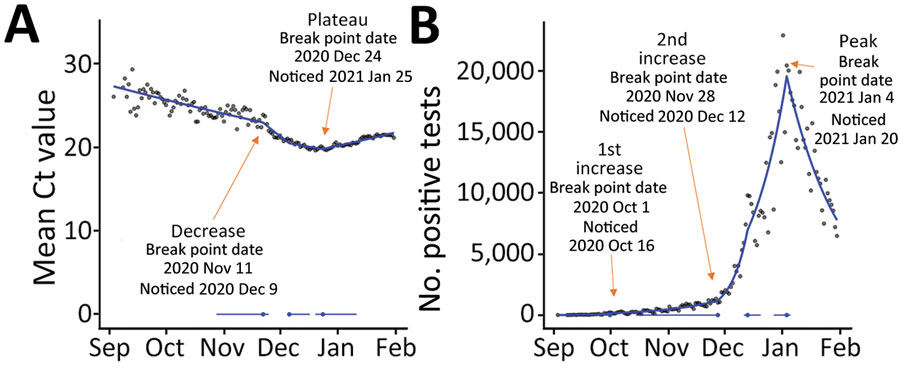
Figure 3. Emergence of novel Alpha variant of SARS-CoV-2 in England, showing mean Ct values (A) and positive results for SARS-CoV-2 S tests (B) for September 3, 2020–January 31, 2021, according to a gamma model. Break points detected through iterative sequential regression (ISR) that indicate significant changes in mean Ct values and positive test counts are labeled. Blue line represents estimated S− mean Ct value and positive test counts by ISR. Blue lines at the base of the graph represent 95% CIs around the break points estimated by the ISR model. Ct, cycle threshold; S, spike; S+, presence of S gene; S−, absence of S gene.
Page created: August 16, 2023
Page updated: September 20, 2023
Page reviewed: September 20, 2023
The conclusions, findings, and opinions expressed by authors contributing to this journal do not necessarily reflect the official position of the U.S. Department of Health and Human Services, the Public Health Service, the Centers for Disease Control and Prevention, or the authors' affiliated institutions. Use of trade names is for identification only and does not imply endorsement by any of the groups named above.