Volume 29, Number 10—October 2023
Research
Characteristics of and Deaths among 333 Persons with Tuberculosis and COVID-19 in Cross-Sectional Sample from 25 Jurisdictions, United States
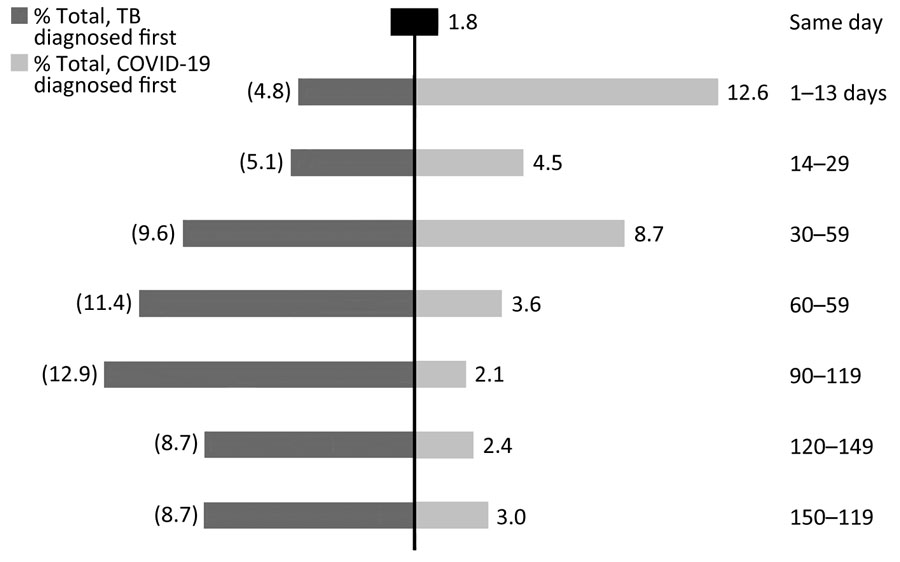
Figure 3

Figure 3. Frequency of 333 persons with TB and COVID-19 co-diagnosed (TB–COVID-19), by sequence and days between TB and COVID-19 diagnoses, 25 US jurisdictions, 2020. The percentage denominator accounts for all 333 persons. Individual percentages may not sum to 100% because of rounding. TB, tuberculosis.
1Group members are listed at the end of this article.
Page created: August 08, 2023
Page updated: September 20, 2023
Page reviewed: September 20, 2023
The conclusions, findings, and opinions expressed by authors contributing to this journal do not necessarily reflect the official position of the U.S. Department of Health and Human Services, the Public Health Service, the Centers for Disease Control and Prevention, or the authors' affiliated institutions. Use of trade names is for identification only and does not imply endorsement by any of the groups named above.