Plasmodium vivax Prevalence in Semiarid Region of Northern Kenya, 2019
Wendy Prudhomme O’Meara

, Linda Maraga, Hannah Meredith, Daniel Esimit, Gilchrist Lokoel, Tabitha Chepkwony, Joseph Kipkoech, George Ambani, Diana Menya, Elizabeth Freedman, Steve Taylor, and Andrew Obala
Author affiliations: Duke University, Durham, North Carolina, USA (W. Prudhomme O’Meara, H. Meredith, E. Freedman, S. Taylor); Moi University, Eldoret, Kenya (W. Prudhomme O’Meara, D. Menya, A. Obala); Academic Model Providing Access to Healthcare, Eldoret (L. Maraga, T. Chepkwony, J. Kipkoech, G. Ambani); Turkana County Health Management, Lodwar, Kenya (D. Esimit, G. Lokoel)
Main Article
Figure
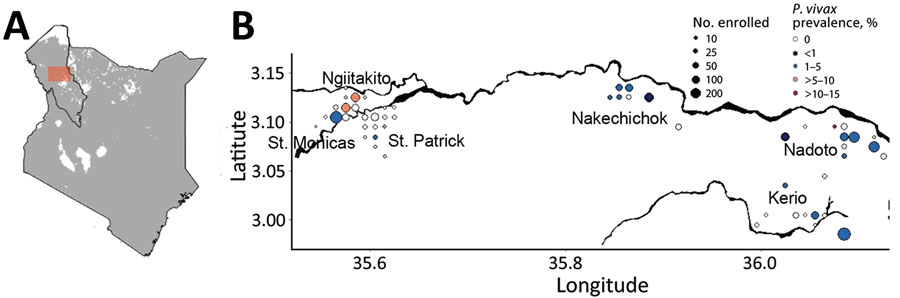
Figure. Prevalence of Plasmodium vivax infection in communities along the Turkwel River in study of P. vivax prevalence in semiarid region of northern Kenya, 2019. Household members of patients with P. falciparum infections were tested for P. vivax infection. A) Study area (red box) in Turkana County, northwestern Kenya. Gray shading indicates <0.01% prevalence of P. vivax infections; white shading indicates no detected infections. Data from the Malaria Atlas Project. B) Coordinates of different study enrollment sites. Main black line across the graph indicates the Turkwel River in Turkana County. Sizes of dots indicate number of household members enrolled; colors indicate percentages of household members who were positive for P. vivax by qualitative PCR.
Main Article
Page created: September 18, 2023
Page updated: October 23, 2023
Page reviewed: October 23, 2023
The conclusions, findings, and opinions expressed by authors contributing to this journal do not necessarily reflect the official position of the U.S. Department of Health and Human Services, the Public Health Service, the Centers for Disease Control and Prevention, or the authors' affiliated institutions. Use of trade names is for identification only and does not imply endorsement by any of the groups named above.