Volume 29, Number 3—March 2023
Dispatch
Extended Viral Shedding of MERS-CoV Clade B Virus in Llamas Compared with African Clade C Strain
Figure 1
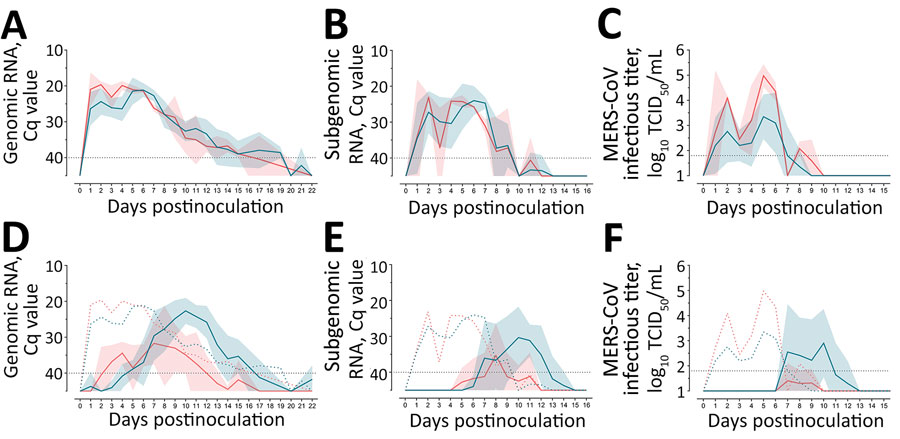
Figure 1. MERS-CoV RNA and infectious virus shedding in llamas experimentally infected with MERS-CoV Egypt/2013 (red) or Qatar15/2015 (blue) strains. A–C) Viral RNA and infectious MERS-CoV shedding of inoculated animals. Genomic (A) and subgenomic (B) viral RNA were quantified in nasal swab samples collected at different times after MERS-CoV inoculation. Infectious MERS-CoV titers (C) were demonstrated in nasal swab specimens collected on different days after MERS-CoV inoculation. Solid lines indicate mean values determined for different MERS-CoV–inoculated groups; shadings represents SD intervals. D–F) Infection profile of naive in-contact llamas). Genomic (D) and subgenomic (E) viral RNA quantified in nasal swab samples collected at different times after MERS-CoV inoculation. Infectious MERS-CoV titers (F) were demonstrated in nasal swab samples collected on different days after MERS-CoV inoculation. Solid lines indicate mean values of the groups of animals infected by contact; shaded areas represent SD intervals. Colored dashed lines indicate mean values calculated for MERS-CoV–inoculated animals. Horizontal dashed lines depict detection limits of assays. Cq, quantification cycle; MERS-CoV, Middle East respiratory syndrome coronavirus; TCID50, 50% tissue culture infective dose.
1Current affiliation: The University of Hong Kong, Hong Kong, China