Skip directly to site content Skip directly to page options Skip directly to A-Z link Skip directly to A-Z link Skip directly to A-Z link
Volume 29, Number 4—April 2023
Research Letter

Genomic Characterization of Respiratory Syncytial Virus during 2022–23 Outbreak, Washington, USA

Stephanie Goya, Jaydee Sereewit, Daniel Pfalmer, Tien V. Nguyen, Shah A.K. Mohamed Bakhash, Elizabeth B. Sobolik, and Alexander L. GreningerComments to Author 
Author affiliations: University of Washington, Seattle, Washington, USA (S. Goya, J. Sereewit, D. Pfalmer, T.V. Nguyen, S.A.K. Mohamed Bakhash, E.B. Sobolik, A.L. Greninger); Fred Hutchinson Cancer Research Center, Seattle (A.L. Greninger)

Main Article

Figure

Molecular epidemiology and genomic characterization of RSV during 2021–22 and 2022–23 outbreaks, Washington, USA. A) Number of patients positive for RSV-A and RSV-B during 2021–22 and 2022–23 outbreaks. Graph shows 5-week averages of RSV-positive cases in Washington detected by PCR; data were taken from The National Respiratory and Enteric Virus Surveillance System (https://www.cdc.gov/surveillance/nrevss/index.html) through December 7, 2022. Tick marks indicate weeks for each month beginning on November 28, 2020, and ending on December 3, 2022. Orange and green dots show collection dates for RSV genomes analyzed in this study. B, C) Maximum-likelihood phylogenetic trees of complete genomes of RSV-A (B) and RSV-B (C) collected during 2017–2022. Collection years for specimens are depicted by tree branch color. RSV genomes from the United States are highlighted with light blue circles at branch tips. Red arrow indicates the location of the major phylogenetic clade comprising most of the sequences from Washington during 2021–22 and 2022–23; black arrows indicate locations of other sequences from Washington during 2022–23. Scale bar indicates nucleotide substitutions per site. Complete phylogenetic trees are provided in the Appendix. RSV, respiratory syncytial virus; RSV-A, RSV subtype A; RSV-B, RSV subtype B.

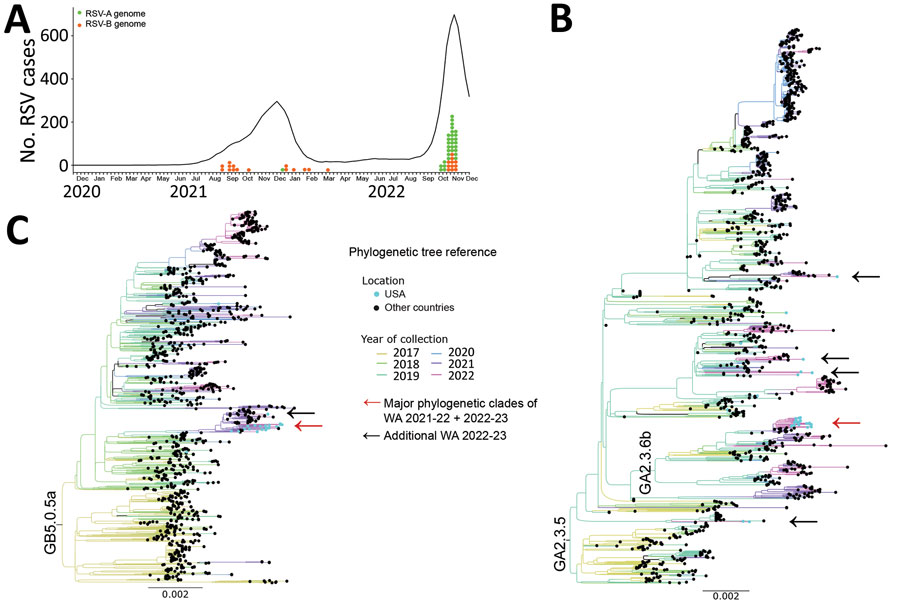
Figure. Molecular epidemiology and genomic characterization of RSV during 2021–22 and 2022–23 outbreaks, Washington, USA. A) Number of patients positive for RSV-A and RSV-B during 2021–22 and 2022–23 outbreaks. Graph shows 5-week averages of RSV-positive cases in Washington detected by PCR; data were taken from The National Respiratory and Enteric Virus Surveillance System (https://www.cdc.gov/surveillance/nrevss/index.html) through December 7, 2022. Tick marks indicate weeks for each month beginning on November 28, 2020, and ending on December 3, 2022. Orange and green dots show collection dates for RSV genomes analyzed in this study. B, C) Maximum-likelihood phylogenetic trees of complete genomes of RSV-A (B) and RSV-B (C) collected during 2017–2022. Collection years for specimens are depicted by tree branch color. RSV genomes from the United States are highlighted with light blue circles at branch tips. Red arrow indicates the location of the major phylogenetic clade comprising most of the sequences from Washington during 2021–22 and 2022–23; black arrows indicate locations of other sequences from Washington during 2022–23. Scale bar indicates nucleotide substitutions per site. Complete phylogenetic trees are provided in the Appendix. RSV, respiratory syncytial virus; RSV-A, RSV subtype A; RSV-B, RSV subtype B.

Main Article

Page created: February 07, 2023
Page updated: March 21, 2023
Page reviewed: March 21, 2023
The conclusions, findings, and opinions expressed by authors contributing to this journal do not necessarily reflect the official position of the U.S. Department of Health and Human Services, the Public Health Service, the Centers for Disease Control and Prevention, or the authors' affiliated institutions. Use of trade names is for identification only and does not imply endorsement by any of the groups named above.
file_external