Volume 29, Number 5—May 2023
Dispatch
Poor Prognosis for Puumala Virus Infections Predicted by Lymphopenia and Dyspnea
Figure
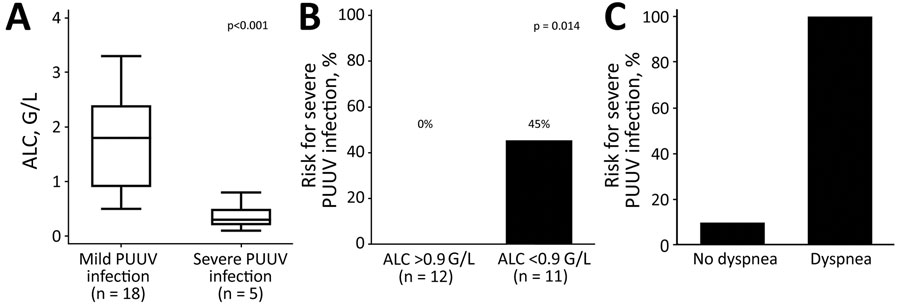
Figure. Poor prognosis for PUUV infections predicted by lymphopenia and dyspnea. A) Box plot showing difference in ALC between patients who had a mild clinical course and those who had a severe clinical course, showing that those with lower ALCs were more likely to have severe illness. Horizontal lines within indicate medians, top lines are maximum values, bottom lines are minimum values, and error bars indicate 25th‒75th percentiles. B) Risk for severe course of PUUV infection according to the calculated ALC cutoff of 0.9 g/L, showing that lower ALC predicted increased risk for severe illness. C) Risk for developing severe PUUV infection according to dyspnea at first medical contact, showing that dyspnea predicted increased risk for severe illness. ALC, absolute lymphocyte count; G, giga; PUUV, Puumala virus.