Volume 30, Number 10—October 2024
Research
Associations between Minority Health Social Vulnerability Index Scores, Rurality, and Histoplasmosis Incidence, 8 US States
Dallas J. Smith , Malavika Rajeev, Kristina Boyd, Kaitlin Benedict, Ian Hennessee, Laura Rothfeldt, Connie Austin, Mary-Elizabeth Steppig, Dimple Patel, Rebecca Reik, Malia Ireland, Judi Sedivy, Suzanne Gibbons-Burgener, Renee M. Calanan, Samantha L. Williams, Sarah Rockhill, and Mitsuru Toda
Figure 5
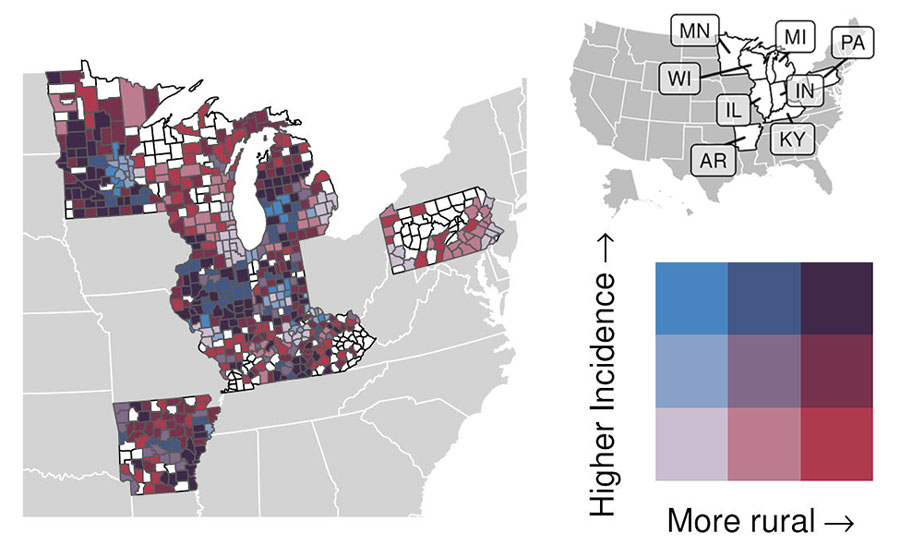
Figure 5. Associations between rurality and histoplasmosis incidence for counties reporting >1 case in 8 US states for which data were available, 2011–2014 and 2019–2020. For counties with >1 case of histoplasmosis, bivariate map shows county incidence (split into low-, mid-, and high-incidence tertiles) versus rurality (micropolitan and noncore, medium and small metropolitan, and large metropolitan counties); colors indicate the combination of incidence-rurality levels for each county. Counties without a case are shown in white. Inset map indicates names of the 8 states.
Page created: August 05, 2024
Page updated: September 23, 2024
Page reviewed: September 23, 2024
The conclusions, findings, and opinions expressed by authors contributing to this journal do not necessarily reflect the official position of the U.S. Department of Health and Human Services, the Public Health Service, the Centers for Disease Control and Prevention, or the authors' affiliated institutions. Use of trade names is for identification only and does not imply endorsement by any of the groups named above.