Associations between Minority Health Social Vulnerability Index Scores, Rurality, and Histoplasmosis Incidence, 8 US States
Dallas J. Smith

, Malavika Rajeev, Kristina Boyd, Kaitlin Benedict, Ian Hennessee, Laura Rothfeldt, Connie Austin, Mary-Elizabeth Steppig, Dimple Patel, Rebecca Reik, Malia Ireland, Judi Sedivy, Suzanne Gibbons-Burgener, Renee M. Calanan, Samantha L. Williams, Sarah Rockhill, and Mitsuru Toda
Author affiliations: Centers for Disease Control and Prevention, Atlanta, Georgia, USA (D.J. Smith, M. Rajeev, K. Boyd, K. Benedict, I. Hennessee, R.M. Calanan, S.L. Williams, S. Rockhill, M. Toda); Arkansas Department of Health, Little Rock, Arkansas, USA (L. Rothfeldt); Illinois Department of Public Health, Springfield, Illinois, USA (C. Austin); Indiana Department of Health, Indianapolis, Indiana, USA (M.-E. Steppig); Kentucky Department of Public Health, Frankfort, Kentucky, USA (D. Patel); Michigan Department of Health and Human Services, Lansing, Michigan, USA (R. Reik); Minnesota Department of Health, St. Paul, Minnesota, USA (M. Ireland); Pennsylvania Department of Health, Harrisburg, Pennsylvania, USA (J. Sedivy); Wisconsin Department of Health Services, Madison, Wisconsin, USA (S. Gibbons-Burgener)
Main Article
Figure 6
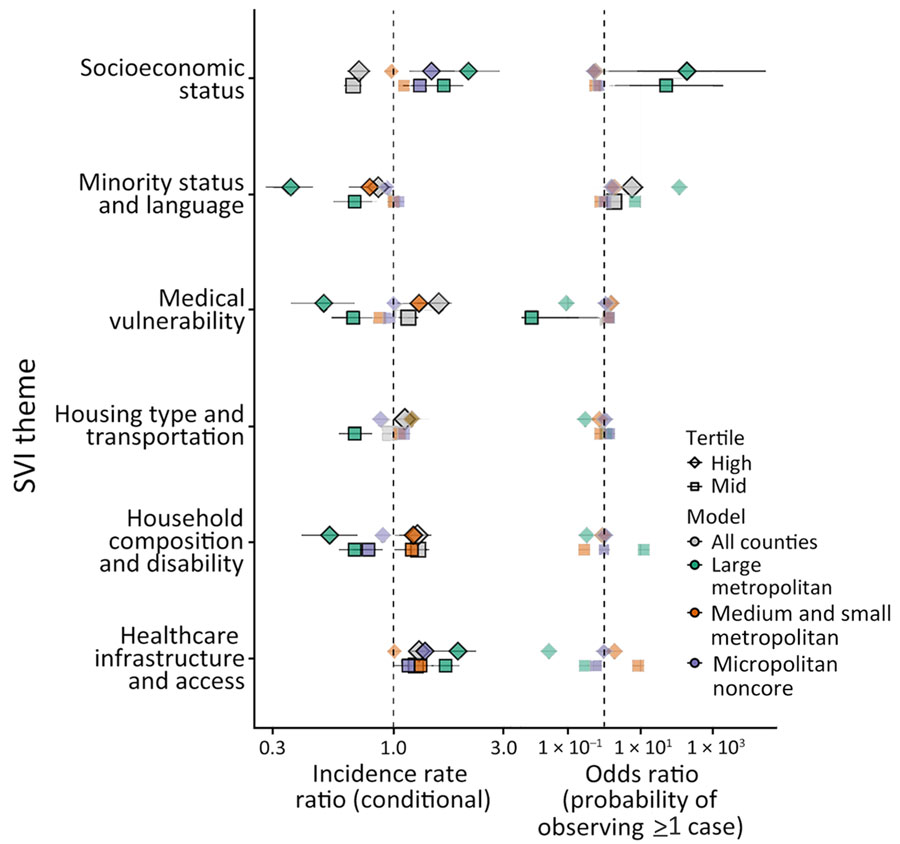
Figure 6. Model effect estimates for association of histoplasmosis incidence with MH SVI themes in 8 US states for which data were available, 2011–2014 and 2019–2020. MH SVI theme scores are interpreted as percentiles; higher scores represent more vulnerable counties. Left column shows incidence rate ratios for the conditional component; right column shows odds ratios for the probability of observing a case in the zero-inflated component. Error bars indicate 95% CIs. Shapes indicate the tertile (mid-tertile or high-tertile, with low-tertile as the reference level), and color indicates the model (model with all counties vs. those stratified by rural classification). Statistically significant effects are indicated by a black outline and increased opacity of points. MH SVI, Minority Health Social Vulnerability Index.
Main Article
Page created: August 05, 2024
Page updated: September 23, 2024
Page reviewed: September 23, 2024
The conclusions, findings, and opinions expressed by authors contributing to this journal do not necessarily reflect the official position of the U.S. Department of Health and Human Services, the Public Health Service, the Centers for Disease Control and Prevention, or the authors' affiliated institutions. Use of trade names is for identification only and does not imply endorsement by any of the groups named above.