Volume 30, Number 11—November 2024
Online Report
Rapid Decision Algorithm for Patient Triage during Ebola Outbreaks
Denis-Luc Ardiet1 , Justus Nsio1, Gaston Komanda, Rebecca M. Coulborn, Emmanuel Grellety, Francesco Grandesso, Richard Kitenge, Dolla L. Ngwanga, Bibiche Matady, Guyguy Manangama, Mathias Mossoko, John K. Ngwama, Placide Mbala, Francisco Luquero, Klaudia Porten, and Steve Ahuka-Mundeke
Figure 5
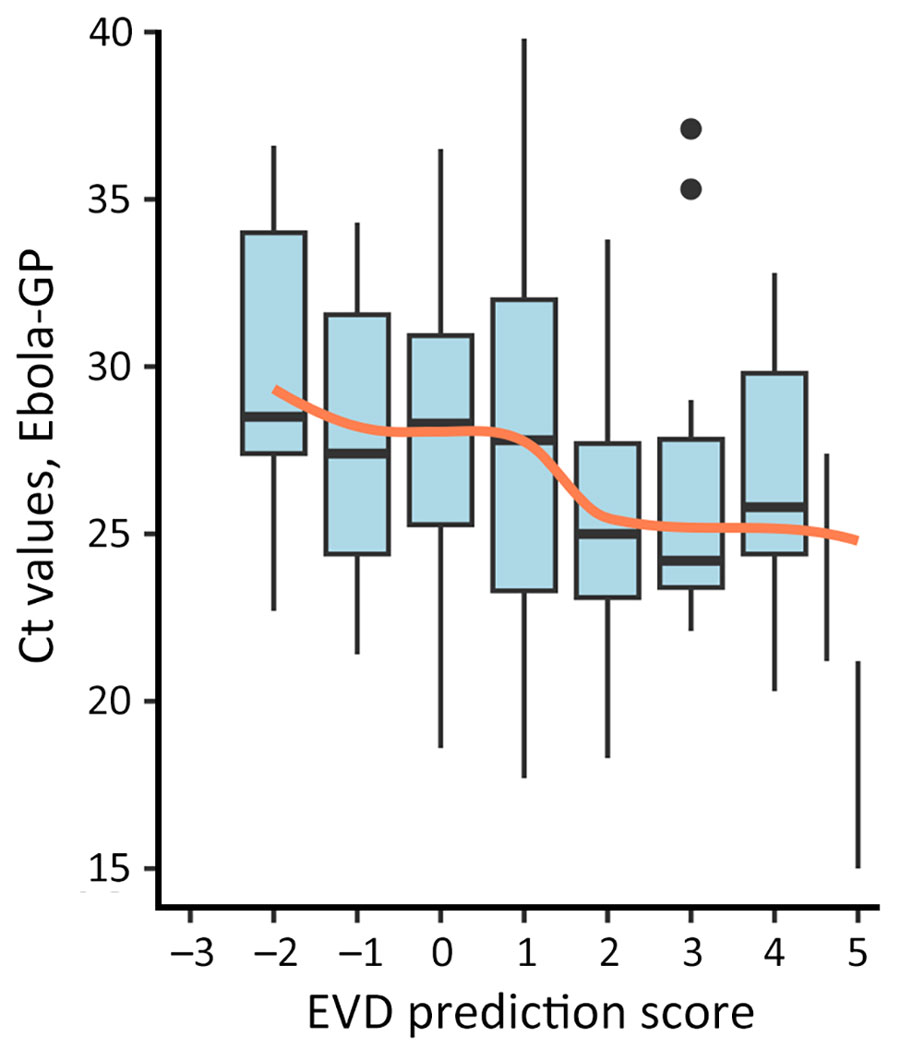
Figure 5. Distribution of Ebola GP cycle threshold Ct values among EVD-positive patients and averages of Ct values (orange line) by EVD prediction score obtained by a rapid decision algorithm for patient triage during Ebola outbreaks used in a population of EVD-suspected patients in Democratic Republic of the Congo during epidemics in 2018–2019. Box plots indicate medians (horizontal black lines), interquartile range (box tops and bottoms), and 95% CIs (error bars); black dots indicate outliers. Ct, cycle threshold; EVD, Ebola virus disease; GP, glycoprotein.
1These authors are co–principal investigators and contributed equally to this article.
Page created: October 03, 2024
Page updated: October 23, 2024
Page reviewed: October 23, 2024
The conclusions, findings, and opinions expressed by authors contributing to this journal do not necessarily reflect the official position of the U.S. Department of Health and Human Services, the Public Health Service, the Centers for Disease Control and Prevention, or the authors' affiliated institutions. Use of trade names is for identification only and does not imply endorsement by any of the groups named above.