Skip directly to site content Skip directly to page options Skip directly to A-Z link Skip directly to A-Z link Skip directly to A-Z link

Disclaimer: Early release articles are not considered as final versions. Any changes will be reflected in the online version in the month the article is officially released.

Volume 30, Number 11—November 2024
Synopsis

Mortality Rates after Tuberculosis Treatment, Georgia, USA, 2008–2019

Sarah Gorvetzian1, Antonio G. Pacheco, Erin Anderson, Susan M. Ray, and Marcos C. SchechterComments to Author 
Author affiliation: Emory University School of Medicine, Atlanta, Georgia, USA (S. Gorvetzian, S.M. Ray, M.C. Schechter); Fundaçāo Oswaldo Cruz, Rio de Janeiro, Brazil (A.G. Pacheco); Georgia Department of Public Health, Atlanta (E. Anderson, S.M. Ray, M.C. Schechter)

Main Article

Figure 2

Survival probabilities in study of mortality rates after TB treatment, Georgia, USA, 2008–2019. Kaplan-Meier curves were used to plot survival probabilities of treated persons with TB over a 10-year period after treatment ended, stratified according to HIV status (A) and place of birth (B). Inset in panel A shows detailed curve with probabilities of 0.80–1.00. p values were calculated by log rank test. Number at risk tables below the curves indicate the total number of patients remaining in the study at each time point in each group, including any persons who experienced the event or were censored at that time point. Missing indicates missing data. TB, tuberculosis.

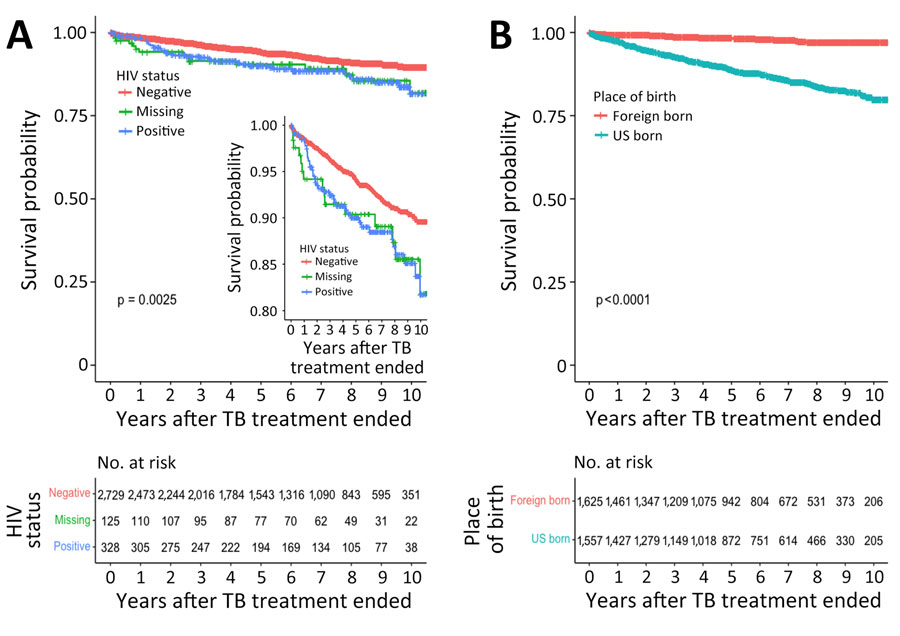
Figure 2. Survival probabilities in study of mortality rates after TB treatment, Georgia, USA, 2008–2019. Kaplan-Meier curves were used to plot survival probabilities of treated persons with TB over a 10-year period after treatment ended, stratified according to HIV status (A) and place of birth (B). Inset in panel A shows detailed curve with probabilities of 0.80–1.00. p values were calculated by log rank test. Number at risk tables below the curves indicate the total number of patients remaining in the study at each time point in each group, including any persons who experienced the event or were censored at that time point. Missing indicates missing data. TB, tuberculosis.

Main Article

1Current affiliation: University of Colorado Anschutz Medical Campus, Aurora, Colorado, USA.

Page created: September 12, 2024
Page updated: October 19, 2024
Page reviewed: October 19, 2024
The conclusions, findings, and opinions expressed by authors contributing to this journal do not necessarily reflect the official position of the U.S. Department of Health and Human Services, the Public Health Service, the Centers for Disease Control and Prevention, or the authors' affiliated institutions. Use of trade names is for identification only and does not imply endorsement by any of the groups named above.
file_external