Volume 30, Number 11—November 2024
Research Letter
Iquitos Virus in Traveler Returning to the United States from Ecuador
Figure 2

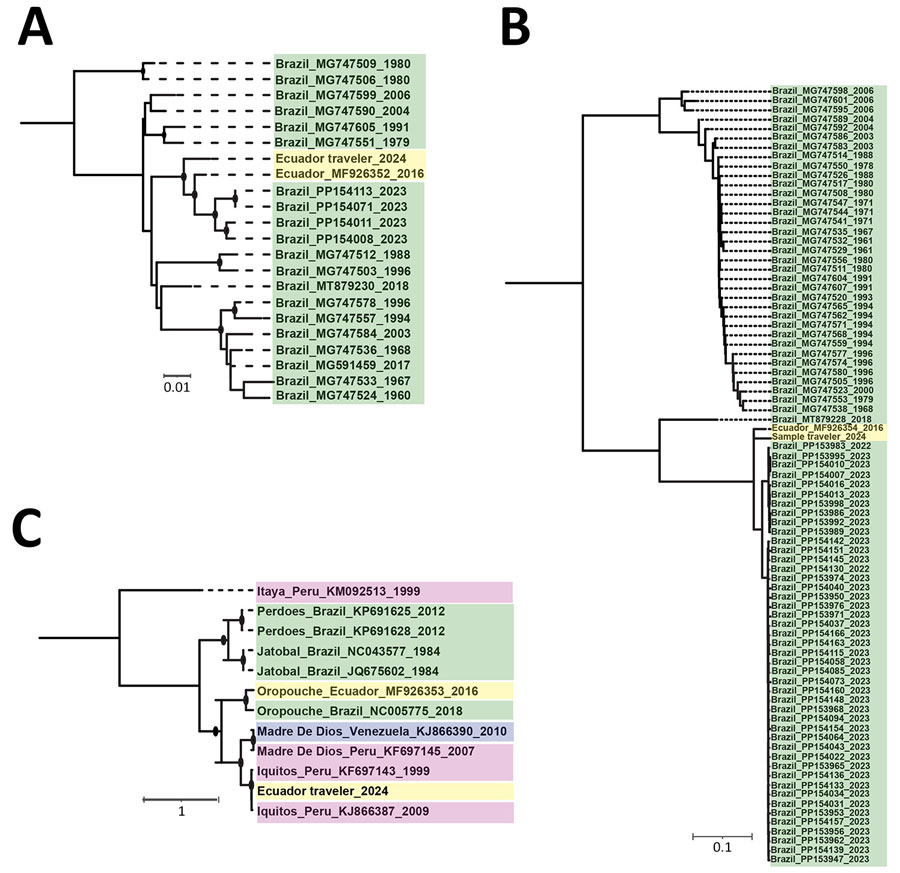
Figure 2. Maximum-likelihood phylogenetic analyses of the small segment (A), large segment (B), and medium segment (C) of Iquitos virus from a traveler returning to the United States from Ecuador. Sequences from the study have been deposited into GenBank (accession nos. PQ325301–4); reference sequences were obtained from National Center for Biotechnology Information Virus database. Panels A and B contain all available complete Oropouche small and large virus sequences, after removing identical sequences; panel C contains all available complete medium sequences for Iquitos, Oropouche, Itaya, Jatobal, Madre de Dios, and Perdoes viruses. Nodes with black circles have ultrafast bootstrap values >90. Sequence names are color-coded according to country of origin. Nucleotide substitution models were as follows: small segment, transversion model with empirical base frequencies and a gamma distribution of rates with 4 categories and α = 0.081; medium segment; transition model with empirical base frequencies and a gamma distribution of rates with 4 categories and α = 5.156; and large segment: general time-reversible model with empirical base frequencies, allowing for invariant sites and a gamma distribution of rates with 2 categories and α = 0.125. Scale bars indicate number of nucleotide substitutions per site.
1These first authors contributed equally to this article.