Volume 30, Number 11—November 2024
Research Letter
Mpox Hepatic and Pulmonary Lesions in HIV/Hepatitis B Virus Co-Infected Patient, France
Figure
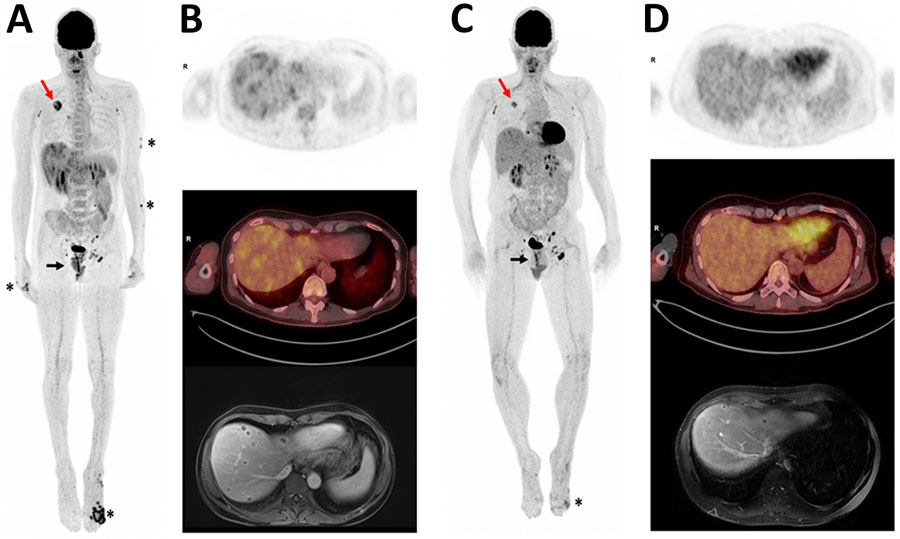
Figure. Positron emission tomography/computed tomography (PET/CT) scans and magnetic resonance imaging (MRI) of HIV/hepatitis B virus co-infected patient in case study of mpox hepatic and pulmonary lesions, France. A) Whole-body 18F-fluorodeoxyglucose (18F-FDG) PET/CT 3-dimensional maximum intensity projection performed in December 2022. Asterisks indicate anterior view of skin lesions. Black arrow indicates lesions in lower rectum; maximum standard uptake value (SUVmax) = 7. Red arrow indicates tumor in upper right lung; SUVmax = 6.4. Heterogeneous hepatic metabolism and multiple small foci of uptake were observed on liver transaxial views, which showed more intense metabolic ranges in the subcapsular region (SUVmax = 3.6). A hypermetabolic contralateral apical pulmonary nodule (SUVmax = 2.7) was also observed but is not visible in this image. B) Upper image shows liver transaxial 18F-FDG PET, middle image is fused PET/CT, and lower image is liver MRI (axial liver acceleration volume acquisition). C) Follow-up whole-body 18F-FDG PET/CT 3-dimensional maximum intensity projection performed in January 2023. Anterior view indicates substantial decreases in metabolic uptake intensities in foot lesion (asterisk), rectum (black arrow), and right lung tumor (red arrow). Tumor was 36 mm versus 46 mm in December, SUVmax 3.9 versus 6.4. Decrease in left apical pulmonary nodule, 9 mm versus 11 mm, SUVmax 1.3 versus 2.7; nodule was not visible in this image. D) Follow-up images indicate substantial decrease of liver abscesses. Upper image shows liver transaxial 18F-FDG PET, middle image is fused PET/CT, and lower image is liver MRI (axial T1 fat suppression volumetric interpolated breath-hold examination portal).