Chikungunya Outbreak Risks after the 2014 Outbreak, Dominican Republic
Gideon Loevinsohn
1, Cecilia Then Paulino
1, Jessica Spring, Holly R. Hughes, Angela Cadavid Restrepo, Helen Mayfield, Michael de St. Aubin, Janeen Laven, Amanda Panella, William Duke, Marie Caroline Etienne, Gabriela Abdalla, Salome Garnier, Naomi Iihoshi, Beatriz Lopez, Lucia de la Cruz, Bernarda Henríquez, Margaret Baldwin, Farah Peña, Adam J. Kucharski, Marietta Vasquez, Emily Zielinski Gutiérrez, Aaron C. Brault, Ronald Skewes-Ramm, Colleen L. Lau, and Eric J. Nilles

Author affiliation: Massachusetts General Hospital, Boston, Massechusetts, USA (G. Loevinsohn); Brigham and Women’s Hospital, Boston (G. Loevinsohn, M. de St. Aubin, M.C. Etienne, G. Abdalla, S. Garnier, N. Iihoshi, M. Baldwin, E.J. Nilles); Ministry of Health and Social Assistance, Santo Domingo, Dominican Republic (C. Then Paulino, L. de la Cruz, B. Henríquez, F. Peña, R. Skewes-Ramm); Centers for Disease Control and Prevention, Fort Collins, Colorado, USA (J. Spring, H.R. Hughes, J. Laven, A. Panella, A.C. Brault); University of Queensland, Brisbane, Queensland, Australia (A. Cadavid Restrepo, H. Mayfield, C.L. Lau); Harvard Humanitarian Initiative, Cambridge, Massachusetts, USA (M. de St. Aubin, M. Baldwin. E.J. Nilles); Pedro Henríquez Ureña National University, Santo Domingo (W. Duke); Centers for Disease Control and Prevention, Central America Regional Office, Guatemala City, Guatemala (B. Lopez, E. Zielinski Gutiérrez); London School of Hygiene and Tropical Medicine, London, UK (A.J. Kucharski); Yale School of Medicine, New Haven, Connecticut, USA (M. Vasquez); Harvard Medical School, Boston (E.J. Nilles)
Main Article
Figure 2

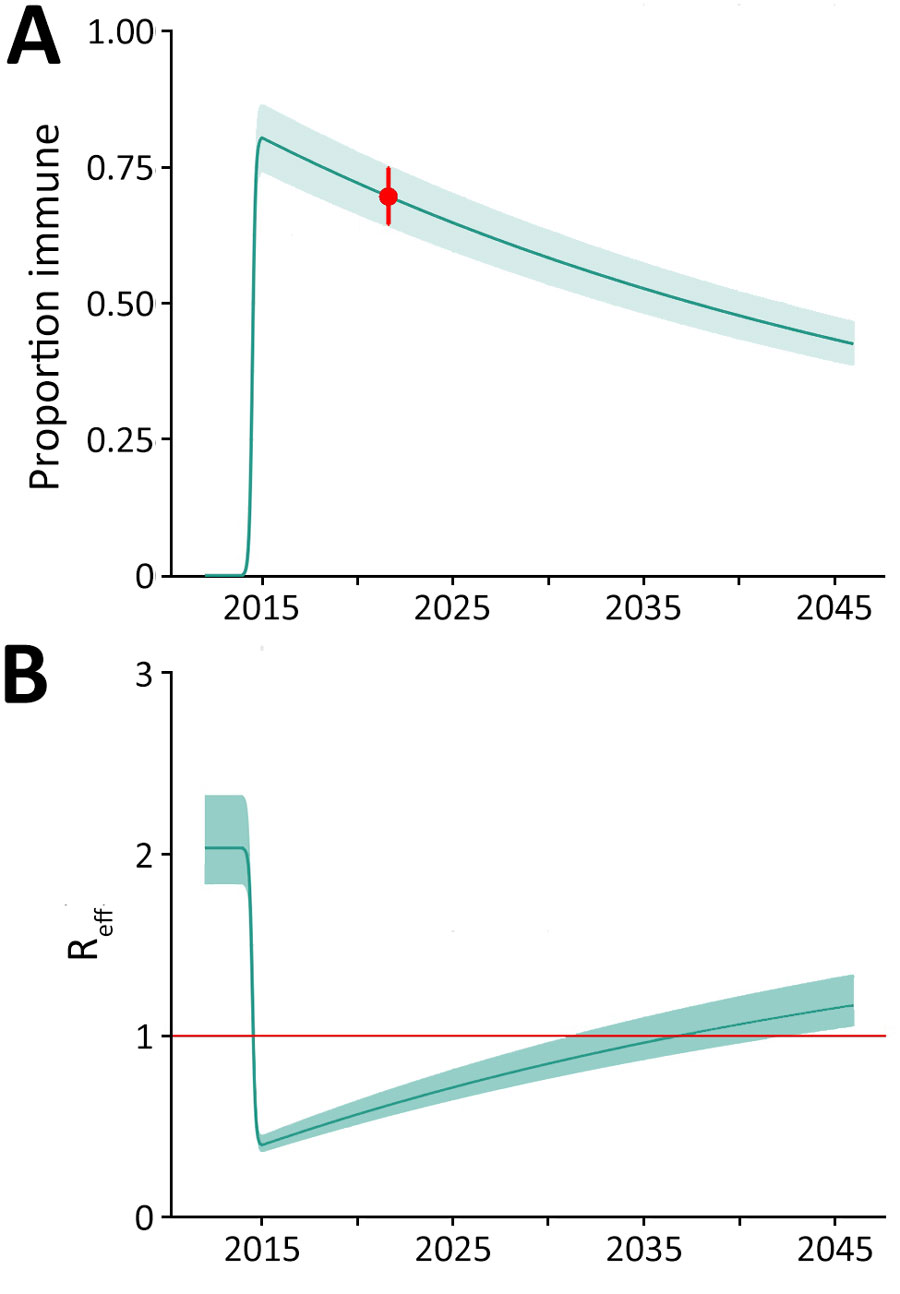
Figure 2. Projected chikungunya population immunity and Reff in study of chikungunya outbreak risks after the 2014 outbreak, Dominican Republic. A) Estimated population immunity from 2012 through 2045 using a simulated population parameterized to the current population seroprevalence (red dot). Solid line represent point estimates and shading 95% CIs. Changes in population immunity over time reflect the introduction of new susceptible persons through births and decrease in immune persons through deaths. B) Projected changes in effective reproductive number over time calculated from the basic reproduction number R0 and population immunity. Solid line represents change in Reff and shading 95% CIs, based on the simulated proportion of the immune population. The solid red horizontal line at Reff = 1 represents the threshold for sustained transmission; values above this line indicate Reff >1, suggesting potential for ongoing transmission, wheras values below this line indicate Reff <1, suggesting a decline in transmission. Reff, effective reproduction number.
Main Article
Page created: October 10, 2024
Page updated: November 26, 2024
Page reviewed: November 26, 2024
The conclusions, findings, and opinions expressed by authors contributing to this journal do not necessarily reflect the official position of the U.S. Department of Health and Human Services, the Public Health Service, the Centers for Disease Control and Prevention, or the authors' affiliated institutions. Use of trade names is for identification only and does not imply endorsement by any of the groups named above.
