Skip directly to site content Skip directly to page options Skip directly to A-Z link Skip directly to A-Z link Skip directly to A-Z link
Volume 30, Supplement—October 2024
SUPPLEMENT ISSUE
Articles

Comprehensive Surveillance of Severe Fever with Thrombocytopenia Syndrome Virus in Patients with Acute Febrile Illness, Wild Rodents, and Trombiculid Larval Mites, Thailand

Piyada LinsuwanonComments to Author , Yong Poovorawan, Keun Hwa Lee, Nutthanun Auysawasdi, Sirima Wongwairot, Chawin Limsuwan, Viboonsak Vuthitanachot, Surachai Leepitakrat, Sompong Vongpunsawasdi, Pornjarim Nilyanimit, Yossapong Paladsing, and Erica Lindroth
Author affiliation: Walter Reed Army Institute of Research–Armed Forces Research Institute of Medical Sciences, Bangkok, Thailand (P. Linsuwanon, N. Auysawasdi, S. Wongwairot, C. Limsuwan, S. Leepitakrat, Y. Paladsing, E. Lindroth); Chulalongkorn University Faculty of Medicine, Bangkok (Y. Poovorawan, S. Vongpunsawasdi, P. Nilyanimit); Hanyang University, Seoul, South Korea (K.H. Lee); Chum Phae Hospital, Khon Kaen, Thailand (V. Vuthitanachot)

Main Article

Figure 1

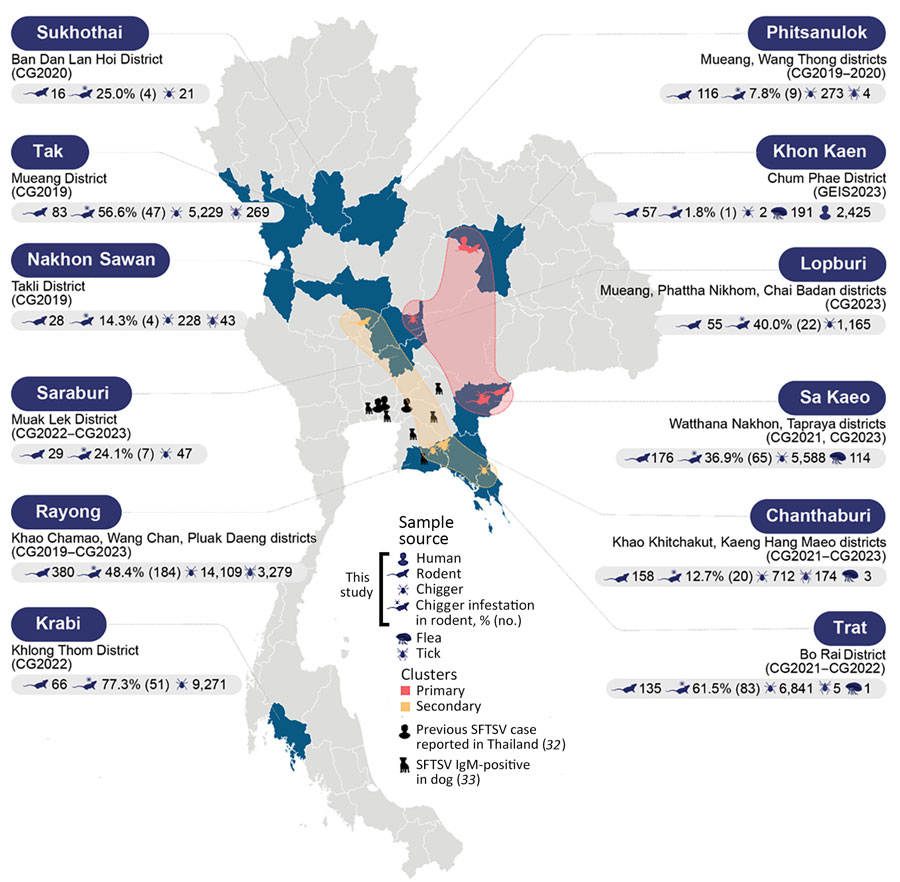
Geospatial clustering of SFTSV, Thailand, 2015–2021. Blue areas on the map represent the surveillance locations in this study. Icons indicate the types of host species and chiggers that tested positive for SFTSV. Data were consolidated to include previous reports of locations where SFTSV-positive patients and dogs were identified, aligning with the current locations of positive samples. Clusters were determined using the K-means clustering method. Primary clusters, highlighted in red, denote regions with a high overall prevalence of SFTSV across all hosts or are considered high-risk areas. Secondary clusters, highlighted in yellow, indicate areas with potential transmission dynamics, particularly involving animal hosts. SFTSV, severe fever with thrombocytopenia syndrome virus.

Figure 1. Geospatial clustering of SFTSV, Thailand, 2015–2021. Blue areas on the map represent the surveillance locations in this study. Icons indicate the types of host species and chiggers that tested positive for SFTSV. Data were consolidated to include previous reports of locations where SFTSV-positive patients and dogs were identified, aligning with the current locations of positive samples. Clusters were determined using the K-means clustering method. Primary clusters, highlighted in red, denote regions with a high overall prevalence of SFTSV across all hosts or are considered high-risk areas. Secondary clusters, highlighted in yellow, indicate areas with potential transmission dynamics, particularly involving animal hosts. SFTSV, severe fever with thrombocytopenia syndrome virus.

Main Article

Page created: September 30, 2024
Page updated: November 11, 2024
Page reviewed: November 11, 2024
The conclusions, findings, and opinions expressed by authors contributing to this journal do not necessarily reflect the official position of the U.S. Department of Health and Human Services, the Public Health Service, the Centers for Disease Control and Prevention, or the authors' affiliated institutions. Use of trade names is for identification only and does not imply endorsement by any of the groups named above.
file_external