Volume 30, Number 5—May 2024
Research Letter
Reemergence of Bordetella parapertussis, United States, 2019–2023
Brooklyn A. Noble , Sarah S. Jiudice, Jay D. Jones, and Tristan T. Timbrook
Figure
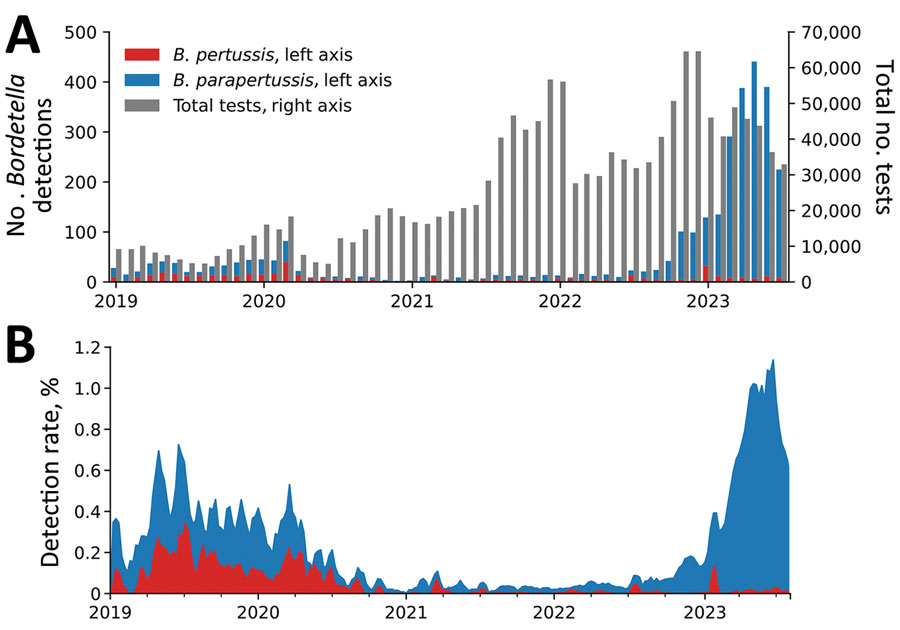
Figure. Bordetalla pertussis and B. parapertussis detection count and detection rates, January 2019–July 2023. A) Total number of tests and number of tests positive for B. pertussis or B. parapertussis per month. Scales for the y-axes differ substantially to underscore patterns but do not permit direct comparisons. B) Detection rate (3-week centered rolling average) for B. pertussis and B. parapertussis.
Page created: March 28, 2024
Page updated: April 24, 2024
Page reviewed: April 24, 2024
The conclusions, findings, and opinions expressed by authors contributing to this journal do not necessarily reflect the official position of the U.S. Department of Health and Human Services, the Public Health Service, the Centers for Disease Control and Prevention, or the authors' affiliated institutions. Use of trade names is for identification only and does not imply endorsement by any of the groups named above.