Skip directly to site content Skip directly to page options Skip directly to A-Z link Skip directly to A-Z link Skip directly to A-Z link
Volume 30, Number 5—May 2024
Research

Kinetics of Hepatitis E Virus Infections in Asymptomatic Persons

Ricarda PlümersComments to Author , Jens Dreier, Cornelius Knabbe, Eike Steinmann, Daniel Todt, and Tanja Vollmer
Author affiliations: Herz- und Diabeteszentrum Nordrhein-Westfalen, Bad Oeynhausen, Germany (R. Plümers, J. Dreier, C. Knabbe, T. Vollmer); German Centre for Infection Research, Bochum (E. Steinmann); Ruhr University Bochum, Germany (E. Steinmann, D. Todt); European Virus Bioinformatics Center, Jena, Germany (D. Todt)

Main Article

Figure 1

Progression of HEV infection in asymptomatic persons determined from retrospectively tested blood samples, Germany. A) Days at which the maximum viral load was reached as well as the time points of last HEV RNA–positive and the first HEV RNA–negative donation. B) Serostatus for HEV IgM and HEV IgG revealing the time points of primary HEV IgM or IgG detection, maximum ratio signal to cutoff, and loss of detectability of HEV IgM. In panels A and B, data points indicate each person; error bars indicate medians with interquartile ranges; circles indicate donors who donated HEV-negative blood before first detection of HEV RNA; and triangles indicate persons who did not donate HEV-negative blood before first detection of HEV RNA. C) percentages of persons who were positive for the markers HEV RNA, HEV IgM, and HEV IgG. D) Progression curves for the percentages of persons in whom the maximum of those markers was exceeded, depending on the time since initial HEV RNA detection. HEV, hepatitis E virus; max, maximum; +, positive; –, negative.

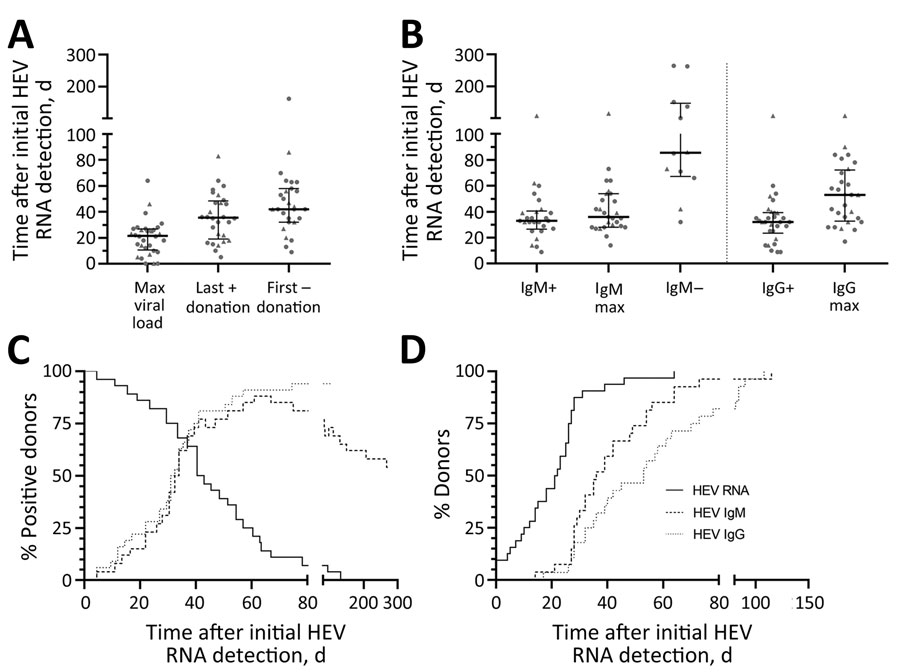
Figure 1. Progression of HEV infection in asymptomatic persons determined from retrospectively tested blood samples, Germany. A) Days at which the maximum viral load was reached as well as the time points of last HEV RNA–positive and the first HEV RNA–negative donation. B) Serostatus for HEV IgM and HEV IgG revealing the time points of primary HEV IgM or IgG detection, maximum ratio signal to cutoff, and loss of detectability of HEV IgM. In panels A and B, data points indicate each person; error bars indicate medians with interquartile ranges; circles indicate donors who donated HEV-negative blood before first detection of HEV RNA; and triangles indicate persons who did not donate HEV-negative blood before first detection of HEV RNA. C) percentages of persons who were positive for the markers HEV RNA, HEV IgM, and HEV IgG. D) Progression curves for the percentages of persons in whom the maximum of those markers was exceeded, depending on the time since initial HEV RNA detection. HEV, hepatitis E virus; max, maximum; +, positive; –, negative.

Main Article

Page created: March 28, 2024
Page updated: April 23, 2024
Page reviewed: April 23, 2024
The conclusions, findings, and opinions expressed by authors contributing to this journal do not necessarily reflect the official position of the U.S. Department of Health and Human Services, the Public Health Service, the Centers for Disease Control and Prevention, or the authors' affiliated institutions. Use of trade names is for identification only and does not imply endorsement by any of the groups named above.
file_external