Skip directly to site content Skip directly to page options Skip directly to A-Z link Skip directly to A-Z link Skip directly to A-Z link
Volume 30, Number 6—June 2024
Research

Incubation Period and Serial Interval of Mpox in 2022 Global Outbreak Compared with Historical Estimates

Luis Ponce, Natalie M. Linton, Wu Han Toh, Hao-Yuan Cheng, Robin N. Thompson, Andrei R. AkhmetzhanovComments to Author , and Jonathan Dushoff
Author affiliations: National Taiwan University, Taipei, Taiwan (L. Ponce, A.R. Akhmetzhanov); California Department of Public Health, Richmond, California, USA (N.M. Linton); Johns Hopkins University, Baltimore, Maryland, USA (W.H. Toh); Taiwan Centers for Disease Control, Taipei (H. Cheng); University of Oxford, Oxford, UK (R.N. Thompson); McMaster University, Hamilton, Ontario, Canada (J. Dushoff)

Main Article

Figure 2

Forest plot of the mean infection-to-onset (A) and infection-to-rash (B) incubation periods for studies conducted during the 2022–2023 global mpox outbreak and analyses of the historical case records. Open circles indicate analyses performed without adjusting for right truncation (ICC); solid circles indicate analysis when an adjustment was made (ICRTC). Whiskers indicate 95% CrIs. Studies are denoted by the leading author and year of publication and ordered by their date of publication; the numbers in parentheses indicate the number of case records used for estimation. (E) indicates that we evaluated the estimates using the data provided in our study; (R) indicates that we re-evaluated estimates for consistency of the methods used. Gray indicates estimates not used for deriving the pooled mean, which is in bold text. Red indicates estimates for historical (pre‒2022 outbreak) data, indicating that they were not used for deriving the pooled mean. CrI, credible interval; ICC, interval censoring corrected model; ICRTC, interval censoring and right truncation corrected model; 2 = -squared statistics indicating the between-study variance measured in days2; ref, reference.

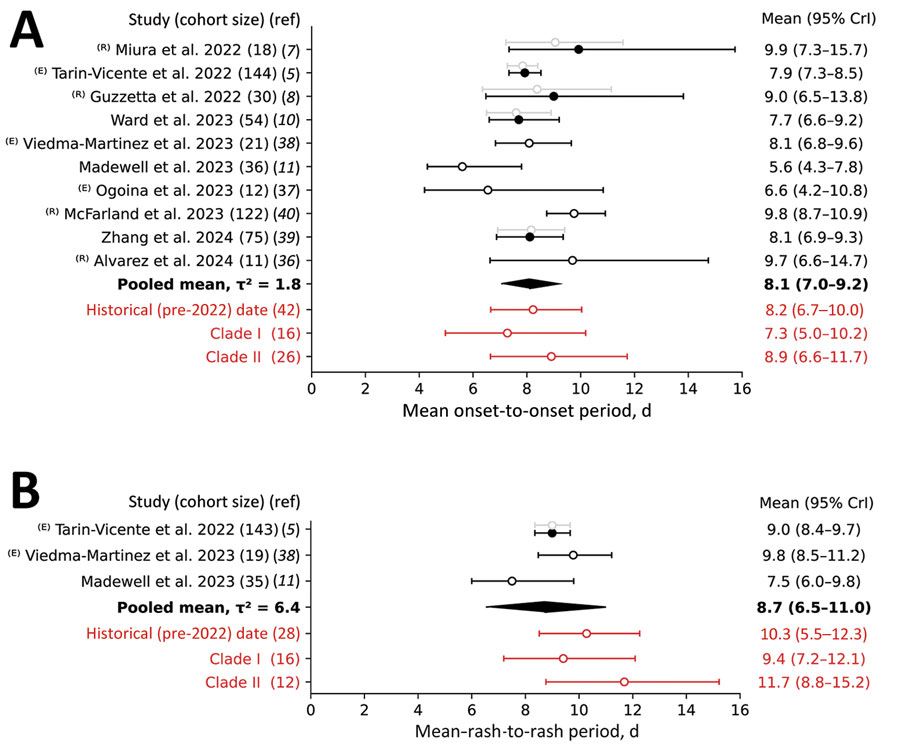
Figure 2. Forest plot of the mean infection-to-onset (A) and infection-to-rash (B) incubation periods for studies conducted during the 2022–2023 global mpox outbreak and analyses of the historical case records. Open circles indicate analyses performed without adjusting for right truncation (ICC); solid circles indicate analysis when an adjustment was made (ICRTC). Whiskers indicate 95% CrIs. Studies are denoted by the leading author and year of publication and ordered by their date of publication; the numbers in parentheses indicate the number of case records used for estimation. (E) indicates that we evaluated the estimates using the data provided in our study; (R) indicates that we re-evaluated estimates for consistency of the methods used. Gray indicates estimates not used for deriving the pooled mean, which is in bold text. Red indicates estimates for historical (pre‒2022 outbreak) data, indicating that they were not used for deriving the pooled mean. CrI, credible interval; ICC, interval censoring corrected model; ICRTC, interval censoring and right truncation corrected model; 2 = -squared statistics indicating the between-study variance measured in days2; ref, reference.

Main Article

Page created: May 09, 2024
Page updated: May 22, 2024
Page reviewed: May 22, 2024
The conclusions, findings, and opinions expressed by authors contributing to this journal do not necessarily reflect the official position of the U.S. Department of Health and Human Services, the Public Health Service, the Centers for Disease Control and Prevention, or the authors' affiliated institutions. Use of trade names is for identification only and does not imply endorsement by any of the groups named above.
file_external