Skip directly to site content Skip directly to page options Skip directly to A-Z link Skip directly to A-Z link Skip directly to A-Z link
Volume 30, Number 6—June 2024
Research

Estimates of SARS-CoV-2 Hospitalization and Fatality Rates in the Prevaccination Period, United States

Isabel GriffinComments to Author , Jessica King1, B. Casey Lyons1, Alyson L. Singleton1, Xidong Deng, Beau B. Bruce, and Patricia M. Griffin
Author affiliations: Centers for Disease Control and Prevention, Atlanta, Georgia, USA (I. Griffin, J. King, B.C. Lyons, X. Deng, B.B. Bruce, P.M. Griffin); Oak Ridge Institute for Science and Education, Oak Ridge, Tennessee, USA (A.L. Singleton)

Main Article

Figure

Upper and lower estimates of case-hospitalization (gray) and case-fatality (black) rates by age group of patients with SARS-CoV-2 infection, United States, 2020. Graphical representation of upper and lower estimates of rates in Tables 1 and 2. For case-hospitalization, lower bound was calculated by including cases with unknown hospitalization information as not hospitalized and upper bound by excluding cases with unknown hospitalization information. For case-fatality, lower bound was calculated by including cases with unknown death status as alive and upper bound by excluding cases with unknown death status information. Reports in which no response was provided about death or hospitalization were excluded from the respective rate calculation. Inset graph provides greater detail for younger age groups by using smaller y-axis values.

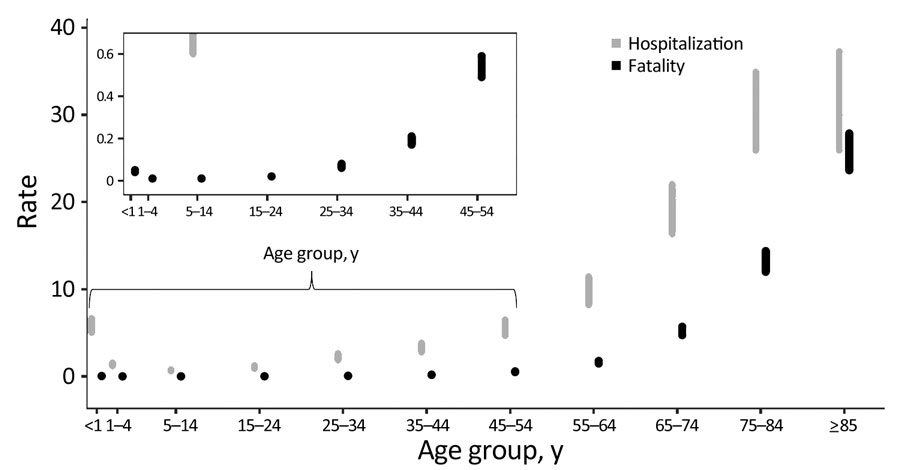
Figure. Upper and lower estimates of case-hospitalization (gray) and case-fatality (black) rates by age group of patients with SARS-CoV-2 infection, United States, 2020. Graphical representation of upper and lower estimates of rates in Tables 1 and 2. For case-hospitalization, lower bound was calculated by including cases with unknown hospitalization information as not hospitalized and upper bound by excluding cases with unknown hospitalization information. For case-fatality, lower bound was calculated by including cases with unknown death status as alive and upper bound by excluding cases with unknown death status information. Reports in which no response was provided about death or hospitalization were excluded from the respective rate calculation. Inset graph provides greater detail for younger age groups by using smaller y-axis values.

Main Article

1These authors contributed equally to this article.

Page created: May 02, 2024
Page updated: May 22, 2024
Page reviewed: May 22, 2024
The conclusions, findings, and opinions expressed by authors contributing to this journal do not necessarily reflect the official position of the U.S. Department of Health and Human Services, the Public Health Service, the Centers for Disease Control and Prevention, or the authors' affiliated institutions. Use of trade names is for identification only and does not imply endorsement by any of the groups named above.
file_external