Skip directly to site content Skip directly to page options Skip directly to A-Z link Skip directly to A-Z link Skip directly to A-Z link
Volume 30, Number 7—July 2024
Research Letter

Fatal Infection in Ferrets after Ocular Inoculation with Highly Pathogenic Avian Influenza A(H5N1) Virus

Jessica A. BelserComments to Author , Xiangjie Sun, Joanna A. Pulit-Penaloza, and Taronna R. Maines
Author affiliation: Centers for Disease Control and Prevention, Atlanta, Georgia, USA

Main Article

Figure 1

Disease severity and systemic spread of Chile/25945 influenza virus after ocular inoculation of ferrets. Ferrets were inoculated by the ocular route as previously described (7) with a high (106 PFU, circles) or low (103 PFU, squares) dose of Chile/25945 virus (100 μL volume), and each was cohoused with a serologically naive ferret 24 hours after inoculation (triangles). A, B) Inoculated (A) and contact (B) animals were weighed daily and humanely euthanized after reaching previously described endpoints (3). Ferret inoculated:contact pairs are indicated with shared colors. C) Systemic tissues were collected from inoculated animals that reached humane endpoints and titered for the presence of infectious virus as previously described (7). Bars represent individual ferrets with the postinoculation day on which humane endpoints were reached and tissues were collected specified per inoculation dose (bar color is linked with ferret morbidity data shown in panel A). Limit of detection was 10 PFU.

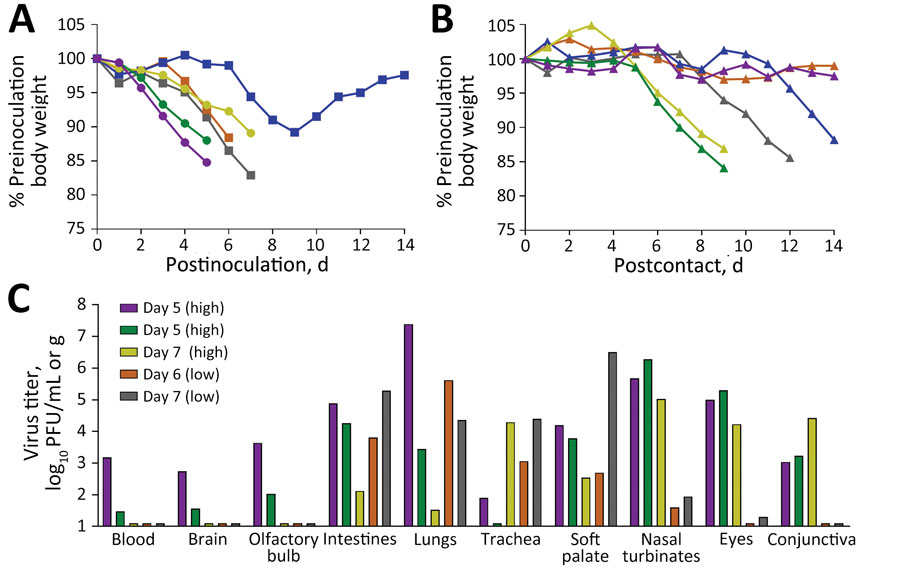
Figure 1. Disease severity and systemic spread of Chile/25945 influenza virus after ocular inoculation of ferrets. Ferrets were inoculated by the ocular route as previously described (7) with a high (106 PFU, circles) or low (103 PFU, squares) dose of Chile/25945 virus (100 μL volume), and each was cohoused with a serologically naive ferret 24 hours after inoculation (triangles). A, B) Inoculated (A) and contact (B) animals were weighed daily and humanely euthanized after reaching previously described endpoints (3). Ferret inoculated:contact pairs are indicated with shared colors. C) Systemic tissues were collected from inoculated animals that reached humane endpoints and titered for the presence of infectious virus as previously described (7). Bars represent individual ferrets with the postinoculation day on which humane endpoints were reached and tissues were collected specified per inoculation dose (bar color is linked with ferret morbidity data shown in panel A). Limit of detection was 10 PFU.

Main Article

Page created: June 10, 2024
Page updated: June 22, 2024
Page reviewed: June 22, 2024
The conclusions, findings, and opinions expressed by authors contributing to this journal do not necessarily reflect the official position of the U.S. Department of Health and Human Services, the Public Health Service, the Centers for Disease Control and Prevention, or the authors' affiliated institutions. Use of trade names is for identification only and does not imply endorsement by any of the groups named above.
file_external